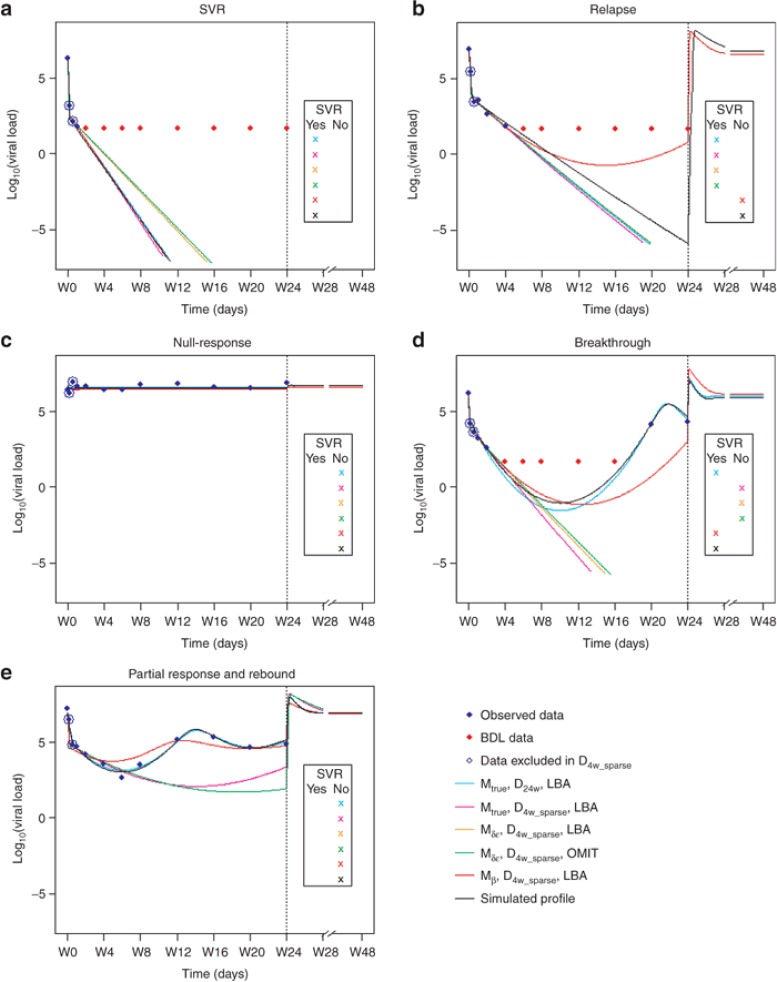
Figure 3.
Examples of some individual fits for the different patterns of virologic responses obtained with different models, designs and BDL data handling methods:(a) SVR, (b) relapse, (c) null-response, (d) breakthrough, (e) partial response and rebound. The solid lines represent the predicted trajectories with the designs Mtrue_D24w_LBA (blue), Mtrue_D4w_sparse_LBA (magenta), Mδε_D4w_sparse_LBA (orange), Mδε_D4w_sparse_OMIT (green), and Mβ_D4w_sparse_LBA (red) and the true profile (black). Vertical line indicates the end of treatment (24 weeks). Observed and BDL data are presented as blue and red diamonds, respectively. Data that were not included in sparse designs are circled. 4-week designs do not contain measurements after W4. Simulation is stopped when the cure boundary is achieved, indicating that the patient has SVR.

