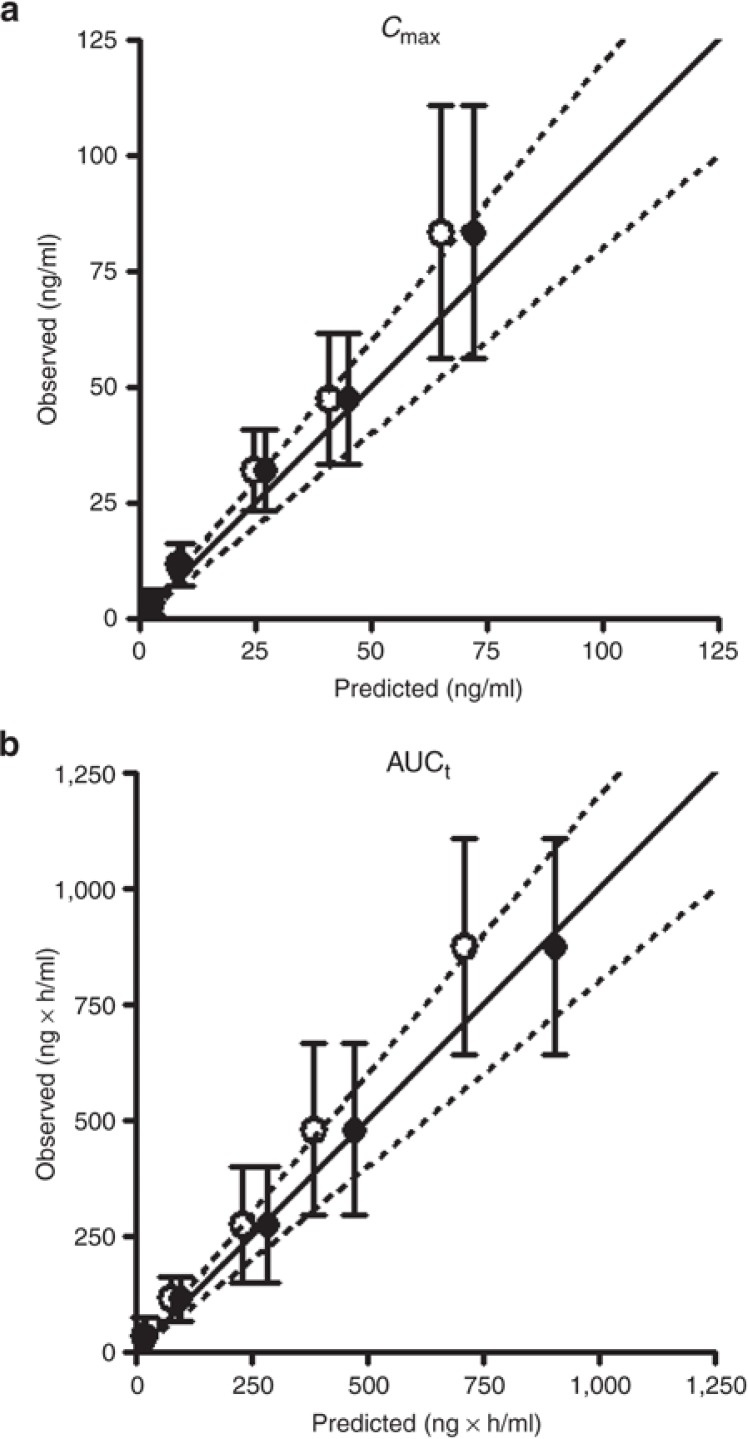
Figure 4.
Comparison of Cmax (a) and AUCt (b) of sirolimus in healthy adults between predicted and observed values. A virtual dose escalation study was carried out at various doses of 0.3, 1, 3, 5, and 8 mg/m2 (comparable with 0.6, 2, 6, 10, and 16 mg, respectively) for a representative healthy adult with Simcyp version 11. In the study, the pharmacokinetics of sirolimus was simulated by the PBPK models (Model 1 and Model 2, see Table 1). Model 1 (closed circle) and Model 2 (open circle) included CLint, other of 100 and 200 µl/min/106 cells, respectively. The predicted PK parameters as Cmax (a) and AUCt (b) were compared with observed data (mean ± SD) from a dose escalation study with the same dosing regimen in adult healthy volunteers.11 The solid line represents the line of unity and the dashed lines represent 80 or 120% of the unity (an area within 20% error).

