Abstract
Background:
Dietary micronutrients have been proposed to protect against oxidative damage and related clinical complications.
Aims:
We aimed to compare the micronutrient intake between individuals with and without metabolic syndrome (MS).
Materials and Methods:
This cross-sectional study included 3800 men and women who were aged between 35 and 65 years. The diagnosis of the MS was based on International Diabetes Federation criteria. Dietary intake of participants was assessed using a questionnaire for 24 h dietary recall. Student's t-test and Mann–Whitney U-tests were used for comparing the micronutrient intake of subjects with or without the MS and the odds ratio for the presence of the MS was calculated for each micronutrient by control for total energy intake adjusted by the residue method.
Results:
The mean age of MS subjects and the control group was 48.8 ± 7.9 years and 47.6 ± 7.6 years, respectively. Energy-adjusted intake of vitamin E (P < 0.05), B2 (P < 0.01), and B12 (P < 0.05) was higher in normal women compared with women with MS. Energy-adjusted intake of vitamin B1 was significantly higher in women with MS. After logistic regression analysis, no significant association between micronutrient intake and MS was shown.
Conclusion:
We found no significant association between micronutrient intake and MS.
Keywords: Dietary assessment, metabolic syndrome, micronutrients
Introduction
Micronutrients are key factors in a range of cellular and biochemical functions including the release of energy for the synthesis, movement, and other functions, which function as coenzymes, cocatalysts, and buffers.[1] Subclinical deficiency of several micronutrients, for example, antioxidants (vitamin C, E, A, and selenium) and others, for example, folic acid, vitamin B12, and vitamin B6 may lead to effects on intracellular homocysteine concentration, that may have important consequences on the progression of chronic diseases by affecting inflammation and presence oxidative stress.[1,2,3] Significant chronic metabolic disruption may occur when consumption of a micronutrient is below the current recommended dietary allowance (RDA).[3]
The interaction of inflammation and oxidative stress is thought to be related to the risk for metabolic syndrome (MS) and the risk of several related conditions.[1,4,5,6] Several studies have reported the potential role of dietary antioxidant intake in the protection against oxidative stress and accompanied clinical complications.[2,4,7]
The prevalence of micronutrient deficiencies have been reported in obese individuals, and have included magnesium (Mg), vitamin B6, iron, vitamin D, vitamin E, vitamin B12, folic acid, selenium, copper, and zinc (Zn),[8,9,10] which may result from inadequate nutrient intake (diet, supplements) and/or alterations in nutrient absorption or metabolism.[11] It has been suggested that high energy intake along with micronutrient deficiencies may lead to an increase in the production of toxic byproducts of incomplete biochemical reactions, this could contribute to further weight gain or the development of associated metabolic diseases.[12,13]
A significant positive association between the dietary total antioxidant capacity (TAC) and the intake of fiber, folic acid, vitamin A, vitamin C, Mg, selenium, and Zn and a negative correlation between TAC and systolic blood pressure, serum glucose, and free fatty acids, independent of gender and daily caloric intake has been reported.[4]
Yet little is known about the adverse relationships between micronutrient intake and MS. Thus, studying the role that these nutrients may play in MS may provide additional motivation for intervention strategies that could reduce the morbidity of MS and subsequent cardiovascular disease (CVD). Therefore, the aim of this manuscript was to compare micronutrient intake between MS patients and subjects without MS and finding the relationship between the micronutrient intake and MS.
Materials and Methods
Subjects
A total of 3800 men and women, aged between 35 and 65 years, were recruited from an urban population using a stratified-cluster method. Exclusion criteria included pregnancy and lactation, individuals with established CVD or diabetes, and individuals taking dietary supplements. Extreme outliers (individuals with values below the 3rd centile or above the 97th centile) for one or more variables were also excluded, as well as those individuals who reported a total daily energy intake in the range 800–4200 kcal.[14] Smoking habit was classified into two categories: current smoker or nonsmoker. Each of subjects provided written, informed consent before the study, which was approved by the Ethics Committee of Mashhad University of Medical Sciences.
Anthropometric assessment
Body weight and height were measured while subjects wore light clothing and no shoes. Body mass index (BMI) was calculated as weight (kg) divided by height (m2). Waist circumference was measured at the midpoint between the bottom of the rib cage and above the top of the iliac crest during the minimal respiration. Resting blood pressure was taken three times by a trained technician using a standardized protocol. The mean value of the two last measurements was used to express the systolic and diastolic blood pressure. The average of three recorded measurements was used in all data analyses.
Biochemical assessment
Blood samples were collected in the tubes, processed, stored, and transported to the laboratory on the ice. Fasting plasma glucose, total cholesterol and its subsets, triglyceride, uric acid and high sensitive C-reactive protein (Hs-CRP) were measured enzymatically using the automated analyzers.
Metabolic syndrome
The diagnosis of MS was based on the definition of the International Diabetes Federation: the presence of three or more of the following components defined MS: fasting plasma glucose ≥110 mg/dl (6.1 mmol/l); systolic or diastolic blood pressure ≥130 or ≥85 mmHg; High-density lipoprotein (HDL) cholesterol <50mg/dl (1.29 mmol/l) for women or <40mg/dl (1.04 mmol/l) for men; triglyceride ≥150 mg/dl (1.79 mmol/l); and waist circumference ≥80 cm for women or ≥94 cm for men.[15]
Dietary assessment
Dietary information was collected using a 24-h recall questionnaire, administered by a trained dietary interviewer in a face-to-face interview, to recall and describe every item of food and beverage consumed over the 24 h period.[1] Individual nutritional intakes were assessed using Dietplan6 software (Forest field Software Ltd., UK). The variables selected for the purpose of this study were total energy intake, crude, and energy adjusted intake of the micronutrients.
Micronutrients were reported as a percentage of the RDA as well.[1]
Assessment of physical activity level
Physical activity levels were assessed using the James and Schofield human energy requirements equations.[16] Physical activity level was calculated as the total energy expenditure as a ratio of the Basal Metabolic Rate over the 24 h period. The questions on physical activity were based on the James and Schofield equations that were selected from those used in the Scottish Heart Health Study/MONItoring of trends and determinants in CArdiovascular disease (MONICA) questionnaire. Questions were divided into time spent on activities during work (including housework), during the nonwork time, and in bed (resting in bed and sleep).
Statistical analysis
Statistical analysis was performed using the SPSS version 16.0 (SPSS, Chicago, IL). Nutrient intake was expressed in gram, milligram, and microgram and as percentages of total energy. It also adjusted for total energy intake through the residual method as an alternative to using nutrient densities to control for confounding by total energy intake and to remove extraneous variation due to total energy intake, regression analyzes was used to compute residuals of nutrient intake by removing the variation caused by total energy intake. In this procedure, the nutrient intakes of the individuals in a group are regressed on their total energy intakes. The residuals from the regression represent the differences between each individual's actual intake and the intake predicted by their total energy intake.[17,18,19] Energy-adjusted nutrient intakes were calculated as the residuals from the regression model, with absolute nutrient intake as the dependent variable, and total energy intake as the independent variable.[17] We used parametric tests for normally distributed data and nonparametric test for nonnormally distributed data. Logistic regression was used to calculate the odds ratios (ORs) and their 95% confidence interval (CIs) for MS, with individuals in the lowest quintile category of micronutrients as the reference category.[17] ORs were adjusted for sex, age, smoking, physical activity level, total energy, BMI, and past medical history. To assess trends across quintile categories, we assigned the median intake of each quintile category to individuals with intakes in the category and then included this quintile median variable as a continuous factor in logistic regression models. The P for trend was the resulting P value of the associated logistic regression coefficient.[17] Categorical variables were compared by Chi-square. Statistical significance was defined as a two tailed P value < 0.05.
Results
The initial sample consisted of 3800 potential participants aged between 35 and 65 years. From this sample, 170 individuals were excluded from the analyzes, including 51 individuals whose total energy intake was outside of the credible range (800-4200 kcal/day), 73 further individuals were excluded as extreme outliers, and 46 individuals were excluded due to incomplete data. These exclusions resulted in a final sample of 3630 participants (34% men; n = 1231, 66% women; n = 2399), with a mean age of 49.25 ± 7.9 years of subjects with MS and 47.97 ± 7.6 years of subjects without MS [Table 1].
Table 1.
Demographic, anthropometric, and clinical characteristics of subjects with and without MS
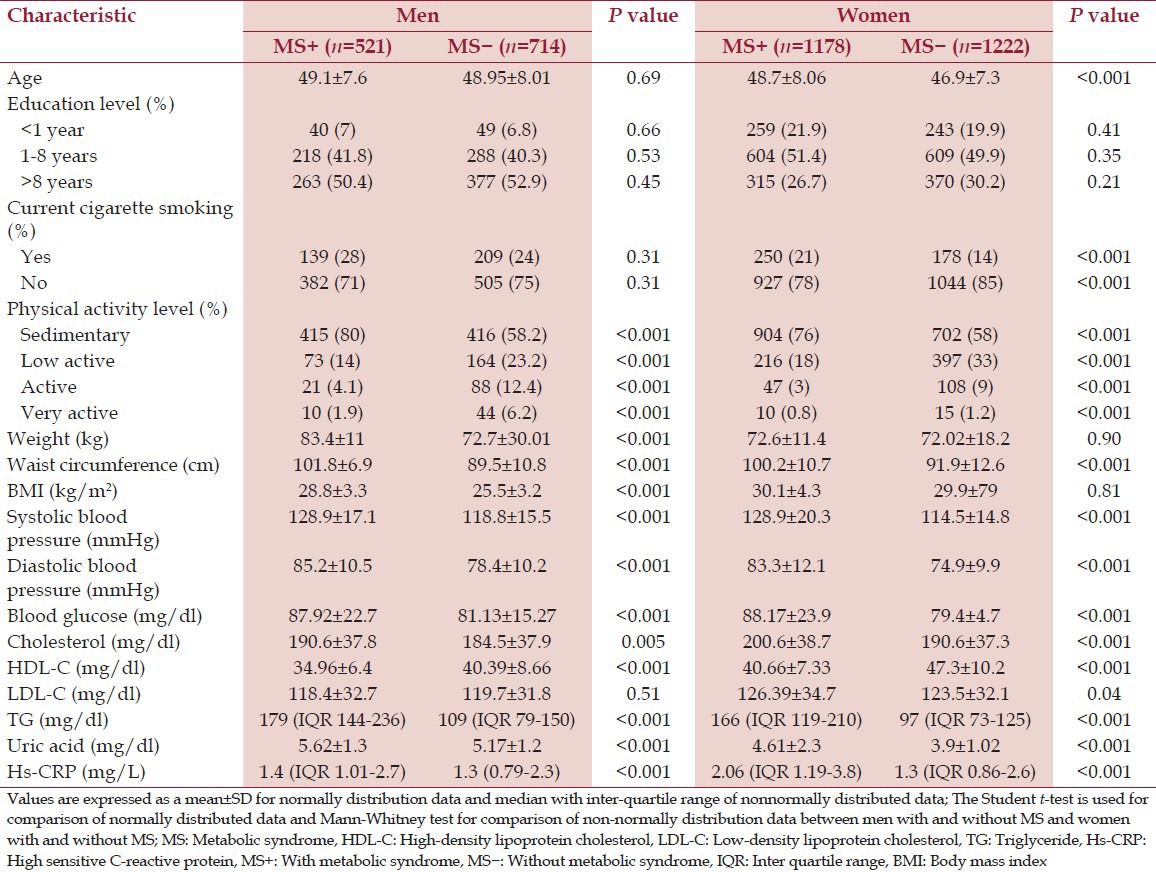
Comparison of anthropometric and clinical parameters between MS patients and subjects without MS
Patients with MS were not significantly heavier (P > 0.05), but did have a higher mean waist circumference (P < 0.001), blood pressure (P < 0.001), blood glucose levels (P < 0.001), serum uric acid (P < 0.001), serum Hs-CRP and triglyceride (P < 0.001). Serum HDL cholesterol level (P < 0.001) was lower in MS versus the subjects without MS. The mean value of Low-density lipoprotein cholesterol (LDL-C) was not significantly different between the two groups (P > 0.05) [Table 1].
Comparison of the crude intake and energy-adjusted intake of nutrients between the MS patients and subjects without MS
Tables 2 and 3 show the mean ± standard error of mean of the crude intake and energy adjusted intake of the micronutrient intake.
Table 2.
Daily intake of the vitamins of subjects with and without MS
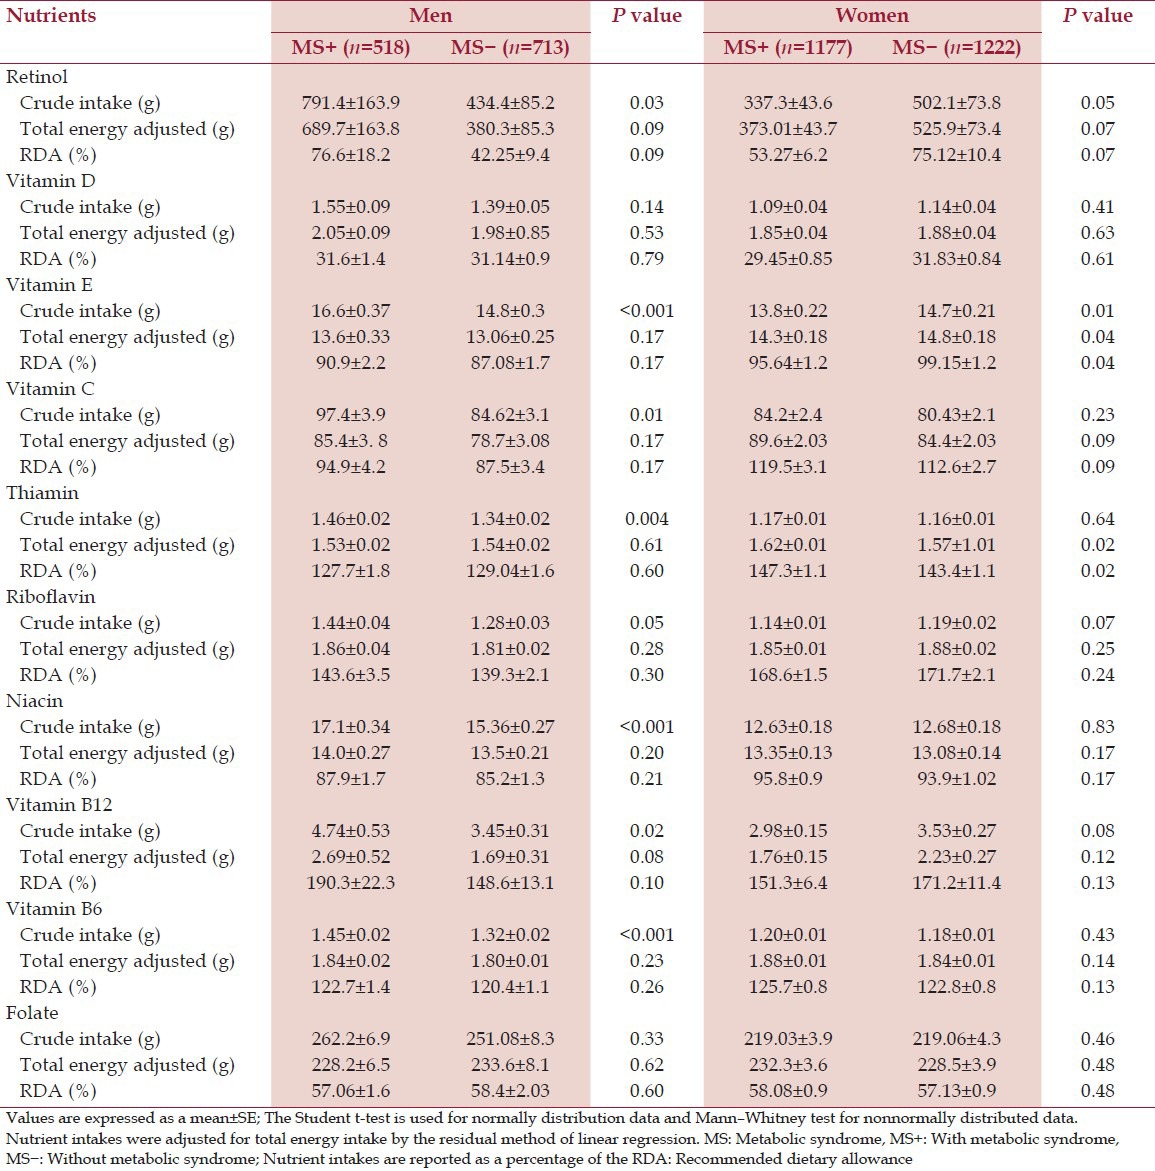
Table 3.
Daily intake of the minerals of subjects with and without MS
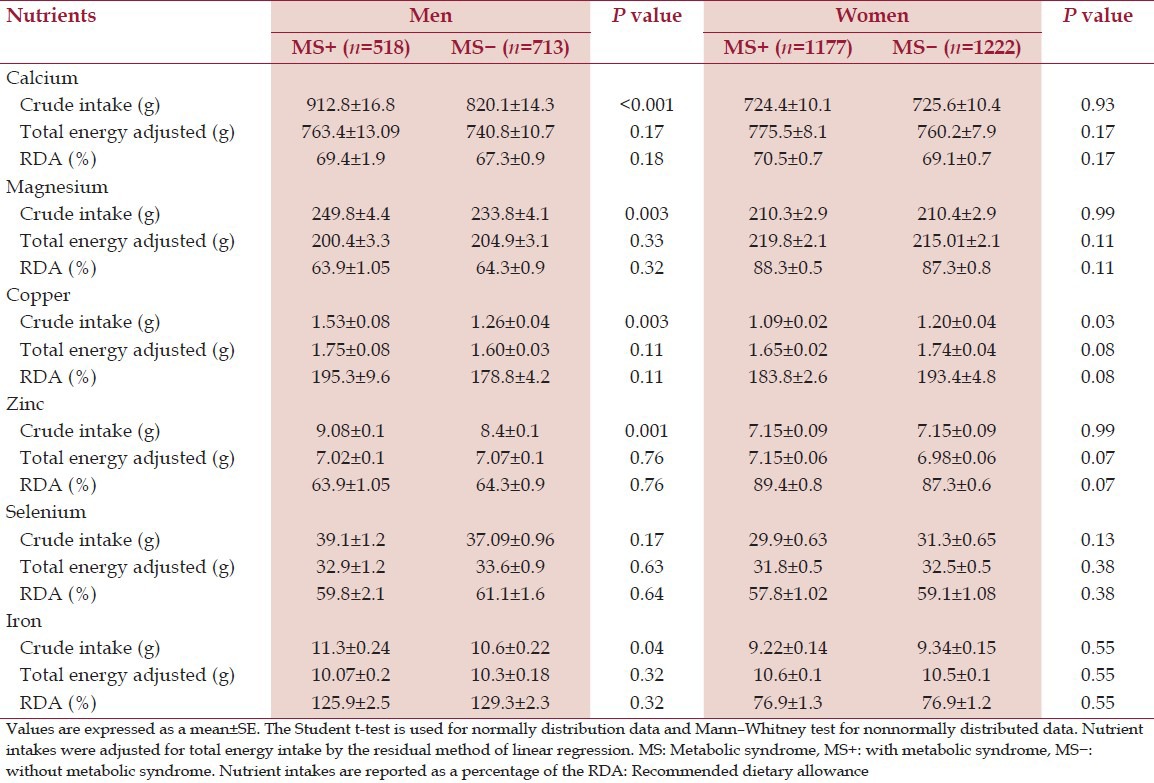
The mean value of crude intake of some micronutrients; calcium (P < 0.001), Mg (P < 0.01), vitamin E (P < 0.001), vitamin C (P < 0.01) in men with MS was higher than men without MS (P < 0.001). However, we found no difference in energy-adjusted intake of nutrient intake between two groups (P > 0.05). In women the crude intake of retinol (P < 0.05), vitamin E (P < 0.01) was higher in women without MS. Furthermore, we observed a significant difference in energy-adjusted intake of vitamin E (P < 0.05), B2 (P < 0.01) and B12 (P < 0.05) between two groups of women [Tables 2 and 3].
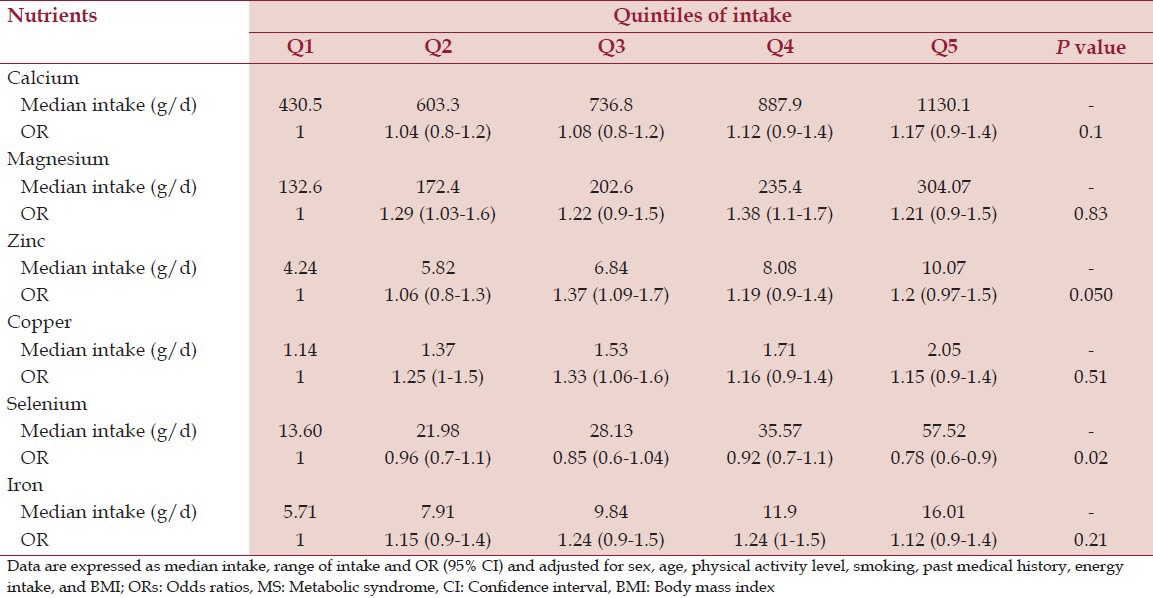
OR (95% CI) of MS across quintiles of micronutrient intake
After adjusting for cofounders including sex, age, physical activity level, and current smoking, past medical history, BMI, and energy intake, we found no association between micronutrient intake and MS [Tables 4 and 5].
Table 4.
ORs of MS across quintiles of energy-adjusted vitamin intake
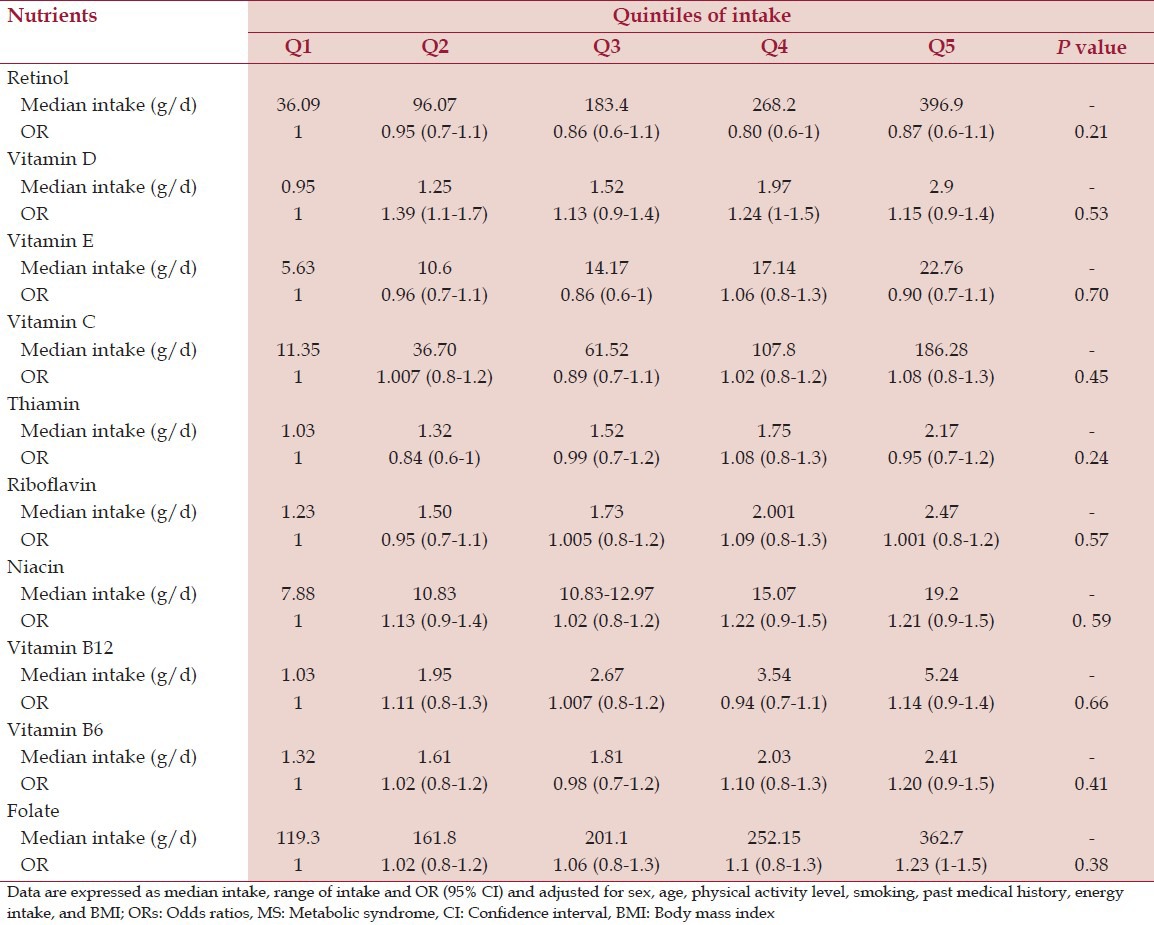
Table 5.
ORs of MS across quintiles of energy-adjusted mineral intake
Discussion
In the present study, we have assessed the dietary intake of antioxidant vitamins (A, C, E) and other vitamins such as; D, B1, B2, B6, B12, niacin, folate and minerals including; calcium, Mg, Zc, copper, iron, selenium. Ultimately, we found no significant difference between the intake of these nutrients in subjects with and without MS.
Several components of the MS are known to be associated with increased oxidative stress.[20,21] Dietary antioxidant intake has been suggested to ameliorate oxidative effects.[1] In the study of Kleshchina and Eliseev, assessment of nutrition in girls with MS revealed a low intake of vitamin E.[22] In the present study, we found that the mean intake of vitamin E was lower in women with MS, but after adjusting for cofounders (sex, age, energy intake, smoking, physical activity level, past medical history, and BMI), we did not observe any relationship between vitamin E intake and MS. Ford et al.[23] and Bruscato et al.[24] have also shown that there was no association between the presence of MS and intake of vitamins C, E, and A. Puchau et al. suggested that dietary TAC is negatively associated with some features of the MS in healthy young adults.[4] This inconsistency may be the result from the fact that our target group is different. Moreover, we considered a control group in our study. Furthermore, our sample size was larger. Lastly our study made different adjustments for confounding variables.
We found no association between vitamin D and calcium intake and MS. Some studies, have suggested that optimization of vitamin D status through sun exposure and increased intake of vitamin D rich diet may reduce the risk of type 2 diabetes and may improve cardiometabolic profile.[25] Several studies have reported an antiobesity effect of dietary calcium, and that dietary calcium may play a role in stimulating lipolysis, thermogenesis, and adipocyte apoptosis.[26,27] Other studies have reported that MS is not associated with overall intake of dietary calcium and vitamin D, but with the type of food ingested.[28,29]
In the present study, we found no relationship between vitamin B1, B2, B6, B12, and folate and MS. Alcázar-Leyva and Alvarado-Vásquez have previously suggested that, the administration of thiamine pyrophosphate to diabetics leads to an improvement in glucose tolerance, but may also provide additional protection to endothelial cells, reducing the risk of vascular damage, to which the diabetic patient is highly susceptible through inducing nitric oxide synthesis.[30] Thiamine acts as a coenzyme for enzymes (transketolase, pyruvate dehydrogenase, and alpha-ketoglutarate dehydrogenase complexes), which contribute in intracellular glucose metabolism. Hence, glucose intolerance and diabetes might be the result of a thiamine-deficient state.[1,31] This difference between our results and other reports could be due to differences in the type of study and individuals that had been investigated. Jeon et al.[32] found that the dietary intake of thiamin in obese individuals is higher than subjects without MS, while Bruscato et al.[24] found no association between thiamin intake and risk of MS as we have now found.
Chen et al.[33] suggested that, N-5, 10-methylenetetrahydrofolate reductase, C677T gene polymorphism may contribute to insulin resistance in Han Chinese with MS, this being associated with increasing Hs-CRP and decreasing vitamin B12 and hence may play an important role in the development of MS-associated type 2 diabetes mellitus.
The results of our present study did not show a significant association between Mg ingestion and the MS. Experimental and clinical studies suggest that Mg intake may be inversely related to the risk of hypertension and type 2 diabetes mellitus and may decrease blood triglyceride and increase HDL cholesterol levels.[34,35] The differences between the results of the present study and previous studies may result from differences in dietary pattern of the populations studied. Furthermore, we have adjusted our statistical models for total dietary energy intake, BMI, family history, physical activity level, smoking, sex, and age.
de Oliveira et al. investigated the association between micronutrients intake and markers of inflammation and subclinical atherosclerosis, and their results do not provide strong support for associations between the micronutrients and markers of inflammation and subclinical atherosclerosis. In this study, dietary nonheme iron and Mg intakes were inversely associated with total homocysteine concentrations, but Zn and heme iron were positively associated with CRP, other tested micronutrient-marker associations were not significant.[2]
Cross-sectional studies considered that greater consumption of fruits, whole grains, nuts, and seeds contain micronutrients that have antioxidant properties (e.g., Vitamins C, E, β-carotene, and Zn) and play essential roles in enzymatic function (e.g., Mg and Zn) are associated with lower concentrations of inflammatory markers that increased risk of MS.[2,36] The differences between our results and previous studies may be explained by differences in sample size, population group and the method of dietary assessment; or the definitions of MS may not be appropriate for an Iranian population; and self-reported intake may be imprecise. Another reason is that dietary intake may have a greater impact in the early phase of life; or probably the gender ratio of the other studies is different from the current one.
The cross-sectional nature of this present study should be considered when interpreting our findings. The responses were based on self-recall and recall bias is a problem with any self-report survey. This may be particularly the case for individuals with obesity or for women. Although the 24 h recall methodology has been largely used in cross-sectional surveys, they could be considered limited by their lack of quantitative accuracy. In the present survey, the differences in mean intake levels of nutrients between under reporters and those who give valid records reduced by energy adjustment through the residual model. Our study includes a large sample of adults to examine the association between nutrient intake and MS. Future longitudinal studies are needed to establish the potential effect and causality of dietary intake on the MS.
Conclusion
There were inconsistent differences in micronutrient intake between the sexes. After adjusting for cofounders, there was not any association between the MS and micronutrient intake.
Acknowledgment
This work was supported by Mashhad University of Medical Science (MUMS), Iran. The results presented in this work are part of Soudabe Motamed's thesis in MUMS.
Footnotes
Source of Support: This work was supported by Mashhad University of Medical Science (MUMS), Iran. The results presented in this work are part of Soudabe Motamed's thesis in MUMS
Conflict of Interest: The authors have declared no potential conflicts of interest with respect to the research, authorship, and/or publication of this article.
References
- 1.Mahan LK, Escott-Stump S, Reymond JL. 13th ed. St. Louis: Elsevier; 2012. Krause's Food and the Nutrition Care Process. [Google Scholar]
- 2.de Oliveira Otto MC, Alonso A, Lee DH, Delclos GL, Jenny NS, Jiang R, et al. Dietary micronutrient intakes are associated with markers of inflammation but not with markers of subclinical atherosclerosis. J Nutr. 2011;141:1508–15. doi: 10.3945/jn.111.138115. [DOI] [PMC free article] [PubMed] [Google Scholar]
- 3.Ames BN. Low micronutrient intake may accelerate the degenerative diseases of aging through allocation of scarce micronutrients by triage. Proc Natl Acad Sci U S A. 2006;103:17589–94. doi: 10.1073/pnas.0608757103. [DOI] [PMC free article] [PubMed] [Google Scholar]
- 4.Puchau B, Zulet MA, de Echávarri AG, Hermsdorff HH, Martínez JA. Dietary total antioxidant capacity is negatively associated with some metabolic syndrome features in healthy young adults. Nutrition. 2010;26:534–41. doi: 10.1016/j.nut.2009.06.017. [DOI] [PubMed] [Google Scholar]
- 5.Damms-Machado A, Weser G, Bischoff SC. Micronutrient deficiency in obese subjects undergoing low calorie diet. Nutr J. 2012;11:34. doi: 10.1186/1475-2891-11-34. [DOI] [PMC free article] [PubMed] [Google Scholar]
- 6.Pendyala G, Thomas B, Joshi SR. Evaluation of Total Antioxidant Capacity of Saliva in Type 2 Diabetic Patients with and without Periodontal Disease: A Case-Control Study. N Am J Med Sci. 2013;5:51–7. doi: 10.4103/1947-2714.106208. [DOI] [PMC free article] [PubMed] [Google Scholar]
- 7.Kundu D, Roy A, Mandal T, Bandyopadhyay U, Ghosh E, Ray D. Oxidative stress in alcoholic and viral hepatitis. N Am J Med Sci. 2012;4:412–5. doi: 10.4103/1947-2714.100993. [DOI] [PMC free article] [PubMed] [Google Scholar]
- 8.García OP, Ronquillo D, Caamaño Mdel C, Camacho M, Long KZ, Rosado JL. Zinc, vitamin A, and vitamin C status are associated with leptin concentrations and obesity in Mexican women: Results from a cross-sectional study. Nutr Metab (Lond) 2012;9:59. doi: 10.1186/1743-7075-9-59. [DOI] [PMC free article] [PubMed] [Google Scholar]
- 9.Zavala G, Long KZ, Garcia OP, Caamano MD, Aguilar T, Salgado LM, et al. Specific micronutrient concentrations are associated with inflammatory cytokines in a rural population of Mexican women with a high prevalence of obesity. Br J Nutr. 2012;9:1–9. doi: 10.1017/S0007114512001912. [DOI] [PubMed] [Google Scholar]
- 10.Moizé V, Deulofeu R, Torres F, de Osaba JM, Vidal J. Nutritional intake and prevalence of nutritional deficiencies prior to surgery in a Spanish morbidly obese population. Obes Surg. 2011;21:1382–8. doi: 10.1007/s11695-011-0360-y. [DOI] [PubMed] [Google Scholar]
- 11.Ledikwe JH, Blanck HM, Khan LK, Serdula MK, Seymour JD, Tohill BC, et al. Low-energy-density diets are associated with high diet quality in adults in the United States. J Am Diet Assoc. 2006;106:1172–80. doi: 10.1016/j.jada.2006.05.013. [DOI] [PubMed] [Google Scholar]
- 12.Kaidar-Person O, Person B, Szomstein S, Rosenthal RJ. Nutritional deficiencies in morbidly obese patients: A new form of malnutrition? Part A: Vitamins. Obes Surg. 2008;18:870–6. doi: 10.1007/s11695-007-9349-y. [DOI] [PubMed] [Google Scholar]
- 13.Muscogiuri G, Sorice GP, Prioletta A, Policola C, Della Casa S, Pontecorvi A, et al. 25-Hydroxyvitamin D concentration correlates with insulin-sensitivity and BMI in obesity. Obesity (Silver Spring) 2010;18:1906–10. doi: 10.1038/oby.2010.11. [DOI] [PubMed] [Google Scholar]
- 14.Esmaillzadeh A, Azadbakht L. Major dietary patterns in relation to general obesity and central adiposity among Iranian women. J Nutr. 2008;138:358–63. doi: 10.1093/jn/138.2.358. [DOI] [PubMed] [Google Scholar]
- 15.Alberti KG, Zimmet P, Shaw J IDF Epidemiology Task Force Consensus Group. The metabolic syndrome – A new worldwide definition. Lancet. 2005;366:1059–62. doi: 10.1016/S0140-6736(05)67402-8. [DOI] [PubMed] [Google Scholar]
- 16.James WP, Schofield EC. New York: Oxford; 1990. Human energy requirement: a manual for planners and nutritionist. [Google Scholar]
- 17.Freire RD, Cardoso MA, Gimeno SG, Ferreira SR Japanese-Brazilian Diabetes Study Group. Dietary fat is associated with metabolic syndrome in Japanese Brazilians. Diabetes Care. 2005;28:1779–85. doi: 10.2337/diacare.28.7.1779. [DOI] [PubMed] [Google Scholar]
- 18.Willett WC, Howe GR, Kushi LH. Adjustment for total energy intake in epidemiologic studies. Am J Clin Nutr. 1997;65:1220S–8. doi: 10.1093/ajcn/65.4.1220S. [DOI] [PubMed] [Google Scholar]
- 19.Willett W, Stampfer MJ. Total energy intake: Implications for epidemiologic analyses. Am J Epidemiol. 1986;124:17–27. doi: 10.1093/oxfordjournals.aje.a114366. [DOI] [PubMed] [Google Scholar]
- 20.Coyne T, Ibiebele TI, Baade PD, McClintock CS, Shaw JE. Metabolic syndrome and serum carotenoids: Findings of a cross-sectional study in Queensland, Australia. Br J Nutr. 2009;102:1668–77. doi: 10.1017/S000711450999081X. [DOI] [PubMed] [Google Scholar]
- 21.Sardi Jde C. Oxidative stress in diabetes and periodontitis. N Am J Med Sci. 2013;5:58–9. [PMC free article] [PubMed] [Google Scholar]
- 22.Kleshchina IuV, Eliseev IuIu. Characteristics of nutrition and vitamin supply in girls with metabolic syndrome. Gig Sanit. 2011;1:68–70. [PubMed] [Google Scholar]
- 23.Ford ES, Mokdad AH, Giles WH, Brown DW. The metabolic syndrome and antioxidant concentrations: Findings from the Third National Health and Nutrition Examination Survey. Diabetes. 2003;52:2346–52. doi: 10.2337/diabetes.52.9.2346. [DOI] [PubMed] [Google Scholar]
- 24.Bruscato NM, Vieira JL, do Nascimento NM, Canto ME, Stobbe JC, Gottlieb MG, et al. Dietary intake is not associated to the metabolic syndrome in elderly women. N Am J Med Sci. 2010;2:182–8. doi: 10.4297/najms.2010.2182. [DOI] [PMC free article] [PubMed] [Google Scholar]
- 25.Al-Daghri NM, Alkharfy KM, Al-Saleh Y, Al-Attas OS, Alokail MS, Al-Othman A, et al. Modest reversal of metabolic syndrome manifestations with vitamin D status correction: A 12-month prospective study. Metabolism. 2012;61:661–6. doi: 10.1016/j.metabol.2011.09.017. [DOI] [PubMed] [Google Scholar]
- 26.Smilowitz JT, Wiest MM, Teegarden D, Zemel MB, German JB, Van Loan MD. Dietary fat and not calcium supplementation or dairy product consumption is associated with changes in anthropometrics during a randomized, placebo-controlled energy-restriction trial. Nutr Metab (Lond) 2011;8:67. doi: 10.1186/1743-7075-8-67. [DOI] [PMC free article] [PubMed] [Google Scholar]
- 27.Sun X, Zemel MB. Dietary calcium regulates ROS production in aP2-agouti transgenic mice on high-fat/high-sucrose diets. Int J Obes (Lond) 2006;30:1341–6. doi: 10.1038/sj.ijo.0803294. [DOI] [PubMed] [Google Scholar]
- 28.Kirii K, Mizoue T, Iso H, Takahashi Y, Kato M, Inoue M, et al. Calcium, vitamin D and dairy intake in relation to type 2 diabetes risk in a Japanese cohort. Diabetologia. 2009;52:2542–50. doi: 10.1007/s00125-009-1554-x. [DOI] [PubMed] [Google Scholar]
- 29.Liu S, Song Y, Ford ES, Manson JE, Buring JE, Ridker PM. Dietary calcium, vitamin D, and the prevalence of metabolic syndrome in middle-aged and older U.S. women. Diabetes Care. 2005;28:2926–32. doi: 10.2337/diacare.28.12.2926. [DOI] [PubMed] [Google Scholar]
- 30.Alcázar-Leyva S, Alvarado-Vásquez N. Could thiamine pyrophosphate be a regulator of the nitric oxide synthesis in the endothelial cell of diabetic patients? Med Hypotheses. 2011;76:629–31. doi: 10.1016/j.mehy.2011.01.015. [DOI] [PubMed] [Google Scholar]
- 31.Beltramo E, Berrone E, Tarallo S, Porta M. Effects of thiamine and benfotiamine on intracellular glucose metabolism and relevance in the prevention of diabetic complications. Acta Diabetol. 2008;45:131–41. doi: 10.1007/s00592-008-0042-y. [DOI] [PubMed] [Google Scholar]
- 32.Jeon KJ, Lee O, Kim HK, Han SN. Comparison of the dietary intake and clinical characteristics of obese and normal weight adults. Nutr Res Pract. 2011;5:329–36. doi: 10.4162/nrp.2011.5.4.329. [DOI] [PMC free article] [PubMed] [Google Scholar]
- 33.Chen AR, Zhang HG, Wang ZP, Fu SJ, Yang PQ, Ren JG, et al. C-reactive protein, vitamin B12 and C677T polymorphism of N-5,10-methylenetetrahydrofolate reductase gene are related to insulin resistance and risk factors for metabolic syndrome in Chinese population. Clin Invest Med. 2010;33:E290–7. doi: 10.25011/cim.v33i5.14354. [DOI] [PubMed] [Google Scholar]
- 34.Mirmiran P, Shab-Bidar S, Hosseini-Esfahani F, Asghari G, Hosseinpour-Niazi S, Azizi F. Magnesium intake and prevalence of metabolic syndrome in adults: Tehran Lipid and Glucose Study. Public Health Nutr. 2012;15:693–701. doi: 10.1017/S1368980011002941. [DOI] [PubMed] [Google Scholar]
- 35.Larsson SC, Wolk A. Magnesium intake and risk of type 2 diabetes: A meta-analysis. J Intern Med. 2007;262:208–14. doi: 10.1111/j.1365-2796.2007.01840.x. [DOI] [PubMed] [Google Scholar]
- 36.Jiang R, Jacobs DR, Jr, Mayer-Davis E, Szklo M, Herrington D, Jenny NS, et al. Nut and seed consumption and inflammatory markers in the multi-ethnic study of atherosclerosis. Am J Epidemiol. 2006;163:222–31. doi: 10.1093/aje/kwj033. [DOI] [PubMed] [Google Scholar]


