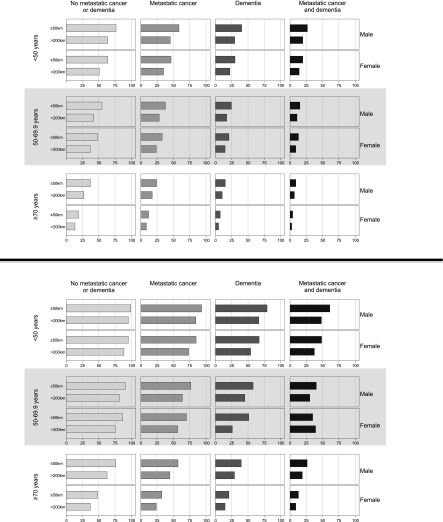
Figure 2.
Proportion initiating chronic renal replacement therapy at the end of follow-up. The top and bottom panels are for patients without and with heavy/severe proteinuria, respectively. In each panel, the columns from left to right, light gray to black bars, show participants with less to more comorbidity, specifically no metastatic cancer or dementia, metastatic cancer, dementia, and both metastatic cancer and dementia. Plots of male and female participants alternate from the top to the bottom of the plot region. The first two rows are for participants aged <50 years, the second two rows are for participants aged 50–69.9 years (shaded), and the last two rows are for participants aged ≥70 years. Lastly, within each graph, the top bars show participants residing ≤50 km from a nephrologist and the bottom bars show participants residing >200 km from a nephrologist.

