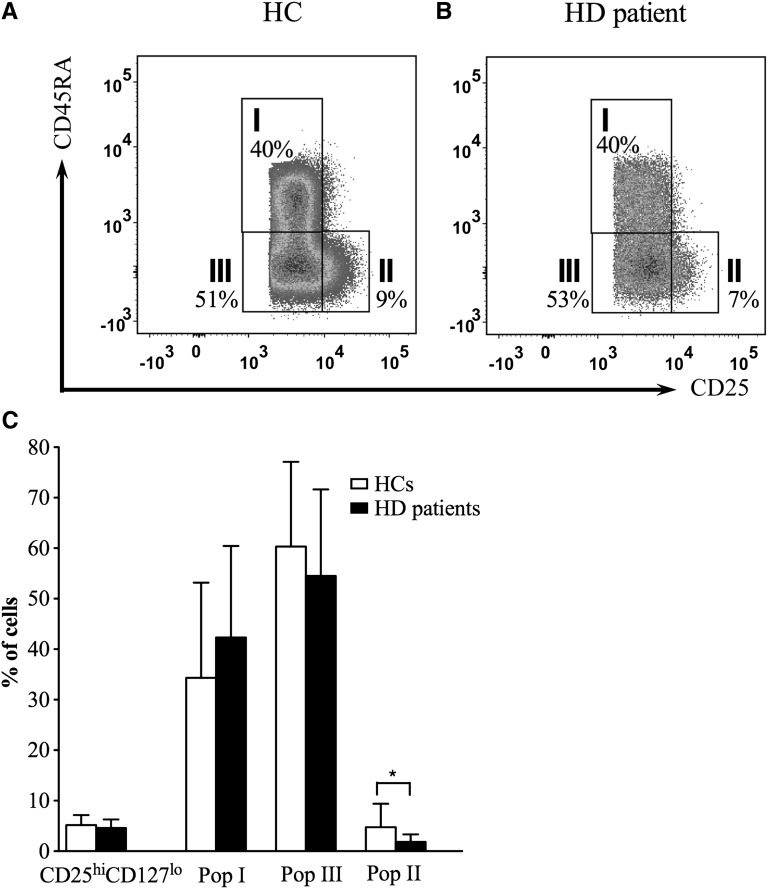
Figure 1.
Comparison of regulatory T cell (Treg) numbers between healthy controls (HCs) and hemodialysis (HD) patients. (A and B) Representative examples from 14 participants of Treg populations I–III in (A) HCs and (B) patients on HD. Please note that the different appearance of the dot plots is because of data acquisition on different FACS machines on separate days. (C) Pooled data from 14 participants in each cohort showing mean percentage (± SD) of total Tregs (CD4+CD25hiCD127lo) in the CD4+ population and the percentage of Treg subpopulations I–III within that population. *P<0.05.

