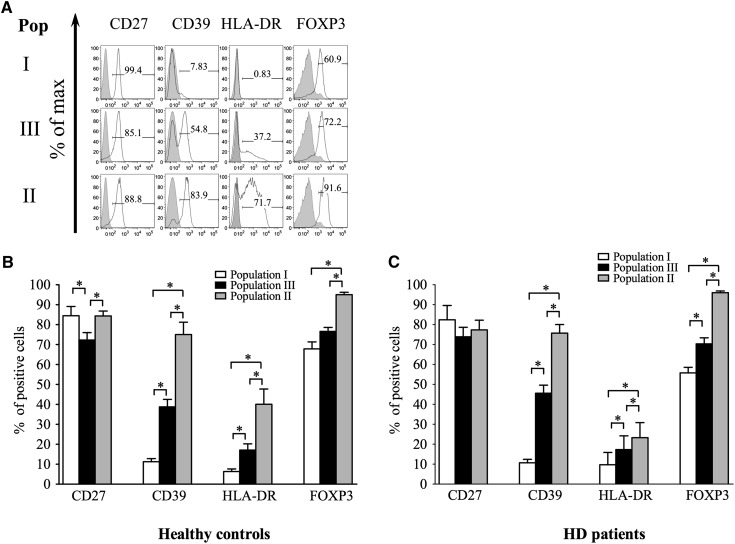
Figure 2.
Expression of FOXP3 and surface markers on gated populations I–III. A shows one representative example from 14 HCs. Numbers on gates show frequency (percentage) of parent population. (B and C) Pooled data from 14 (B) HCs and (C) HD patients showing mean percentage expression ± SD of each marker in the three Treg populations. *P<0.05.

