Figure 3.
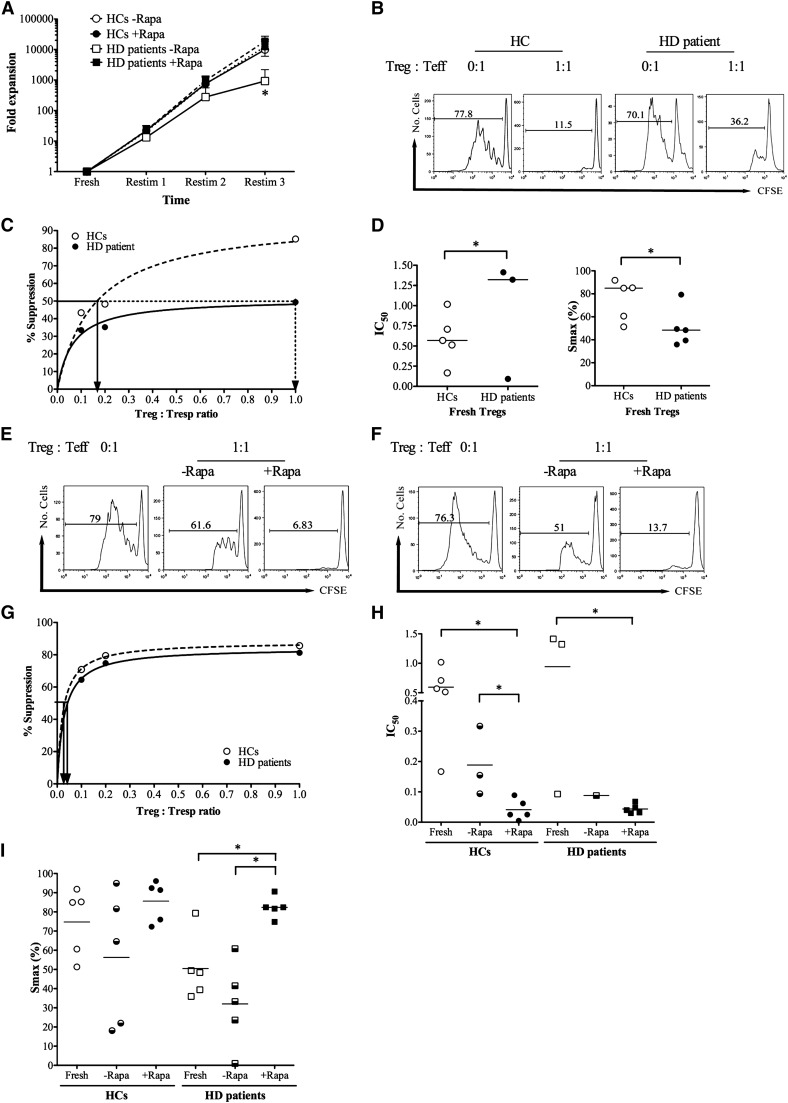
In vitro expansion of Tregs from HD patients under good manufacturing practice (GMP) -compatible conditions and suppressive function before and after expansion. (A) Fold expansion of Tregs per restimulation (restim) in the presence and absence of Rapamycin. *P<0.05 relative to no Rapamycin. (B–D) Baseline suppression of carboxyfluorescein succinimidyl ester (CFSE) -labeled autologous responder T cells (Tresps). (B) A representative example of suppression of CFSE dilution in the absence (0:1) and presence (1:1) of Tregs at 1:1 ratio. (C) Representative regression plot of percent suppression against Treg:Tresp ratio for the calculation of the Treg:Tresp ratio sufficient for 50% suppression (IC50); straight lines show IC50 for HCs, and dotted lines show IC50 for HD patients. (D) Cumulative IC50 and maximum suppression (Smax) for Tregs from five HCs and five patients on HD. Please note that only three IC50 values could be calculated for HD Tregs, because the other two were poorly suppressive. (E–I) Suppressive capacity of Tregs after expansion in vitro in the absence (−Rapa) and presence (+Rapa) of Rapamycin. (E and F) Representative examples of suppression of CFSE dilution in the absence (0:1) and presence (1:1) of Tregs at 1:1 ratio for (E) HC and (F) HD Tregs. (G) Representative regression plot of percent suppression against Treg:Tresp ratio; straight lines show IC50 for HCs, and dotted line show IC50 for paired HD patient. The example is taken from a Rapamycin-treated pair of Tregs. (H and I) IC50 and Smax for Tregs expanded with and without Rapamycin compared with freshly isolated Tregs. Please note that missing IC50 values are because of poor suppressive ability. *P<0.05.

