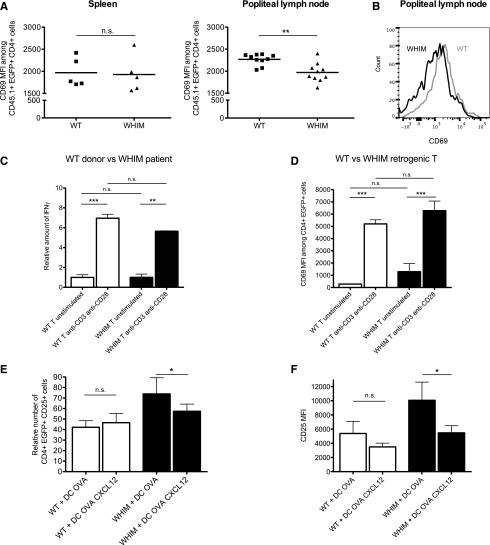
Figure 5.
Aberrant responses of WHIM-CXCR4 T cells caused by reduced synapse stability. (A) WT or WHIM-CXCR4 retrogenic mice were immunized with OVA peptide in their hind footpads. Expression of early activation marker CD69 (anti-CD69 antibody mean fluorescence intensity) on retrogenic CD4+ T cells from the spleen or draining lymph nodes (popliteal) of immunized animals (n = 5) at 12 hours post immunization is shown. A normality test was performed followed by an unpaired Student t test: Popliteal, P = .0015; spleen, P = .9. (B) Representative histograms of CD69 expression by EGFP+ CD4+CD45.1+ rgWT or rgWHIM T cells in the popliteal lymph nodes of the animals analyzed. (C) Healthy donor or WHIM patient (G336X) CD4+ T cells were activated by anti-CD3– and anti-CD28–coated beads. IFNγ production was measured by ELISA at 48 hours. Normalized results are shown to enable comparison of different donors. (D) rgWT or rgWHIM T cells were activated in tissue culture plates by anti-CD3 and anti-CD28. CD69 expression was measured at 12 hours. Anti-CD69 antibody mean fluorescence intensity on CD4+EGFP+ rgWT or rgWHIM T cells is shown. **P < .01; ***P < .001 (1-way ANOVA and Tukey’s posttest). A representative experiment of 2 experiments is shown. (E) rgWT or rgWHIM T cells were placed with cognate antigen-pulsed (OVA) DC in the upper chamber of a transwell assay plate, and 25 nM CXCL12 was added or not to the lower chamber. The cells were incubated for 2 hours in the transwell plates before being transferred to serum-containing wells for 12 hours. The number of CD25+ cells among EGFP+CD4+ T cells in the pooled upper and lower chamber cells at the end of the incubation is shown in (E), normalized for differences in the transduction efficiency between the rgWT and rgWHIM donor mice. CD25 expression (anti-CD25 antibody mean fluorescence intensity) on EGFP+CD4+ T cells of the pooled upper and lower chamber cells at the end of the incubation is shown in (F). Both values are *P < .05 (repeated measures 1-way ANOVA). The experiment was performed twice, and the summary of results (mean ± SEM) is shown. It is noteworthy that, in the absence of antigen, the rgWHIM T cells displayed a higher baseline CD25 expression. n.s., not significant.

