
Fig 2.
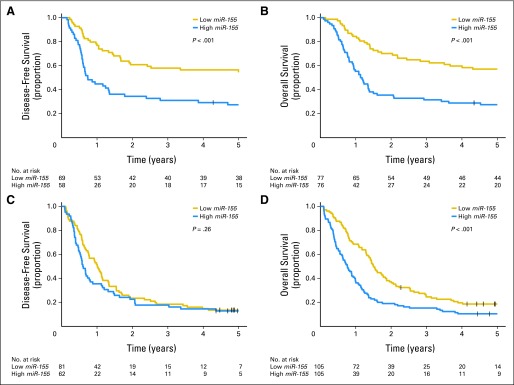
Survival curves according to age group and miR-155 expression (high v low): (A) disease-free survival and (B) overall survival of younger patients and (C) disease-free survival and (D) overall survival of older patients.
Official websites use .gov
A
.gov website belongs to an official
government organization in the United States.
Secure .gov websites use HTTPS
A lock (
) or https:// means you've safely
connected to the .gov website. Share sensitive
information only on official, secure websites.
Survival curves according to age group and miR-155 expression (high v low): (A) disease-free survival and (B) overall survival of younger patients and (C) disease-free survival and (D) overall survival of older patients.