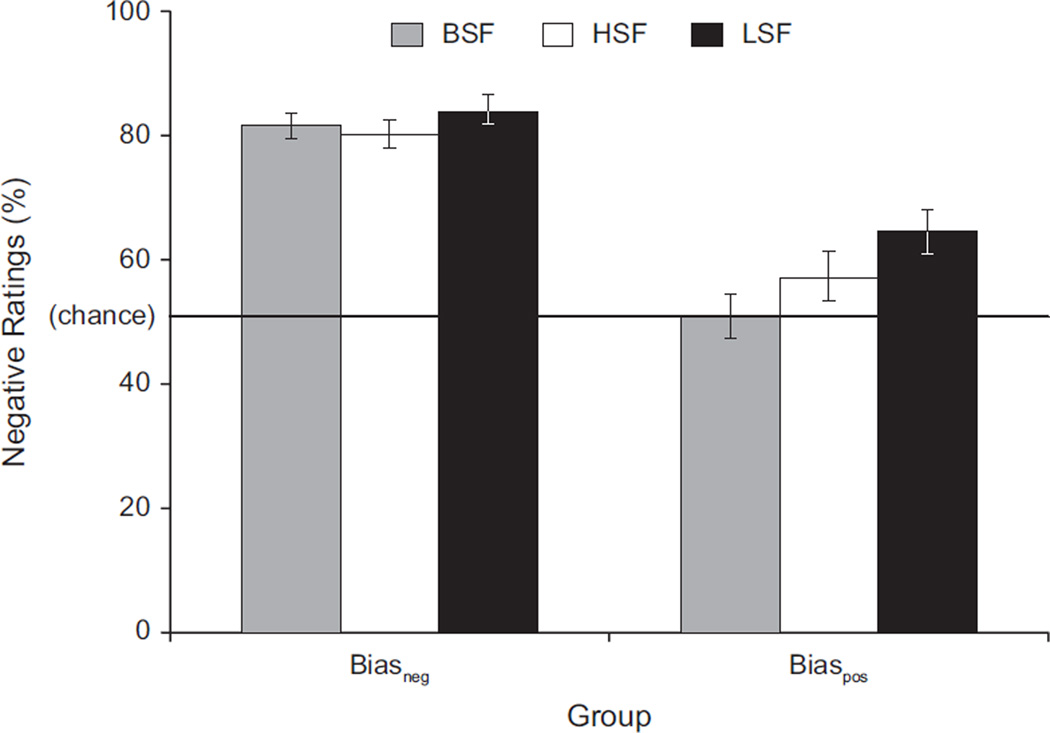
Fig. 3.
Percentage of negative ratings of surprised expressions as a function of spatial frequency for the individuals who tended to interpret surprise as negative (Biasneg group) and those who tended to interpret surprise as positive (Biaspos group). Error bars represent standard errors of the mean. BSF = broad spatial frequency (i.e., intact image); HSF = high spatial frequency; LSF = low spatial frequency.

