
Figure 4.
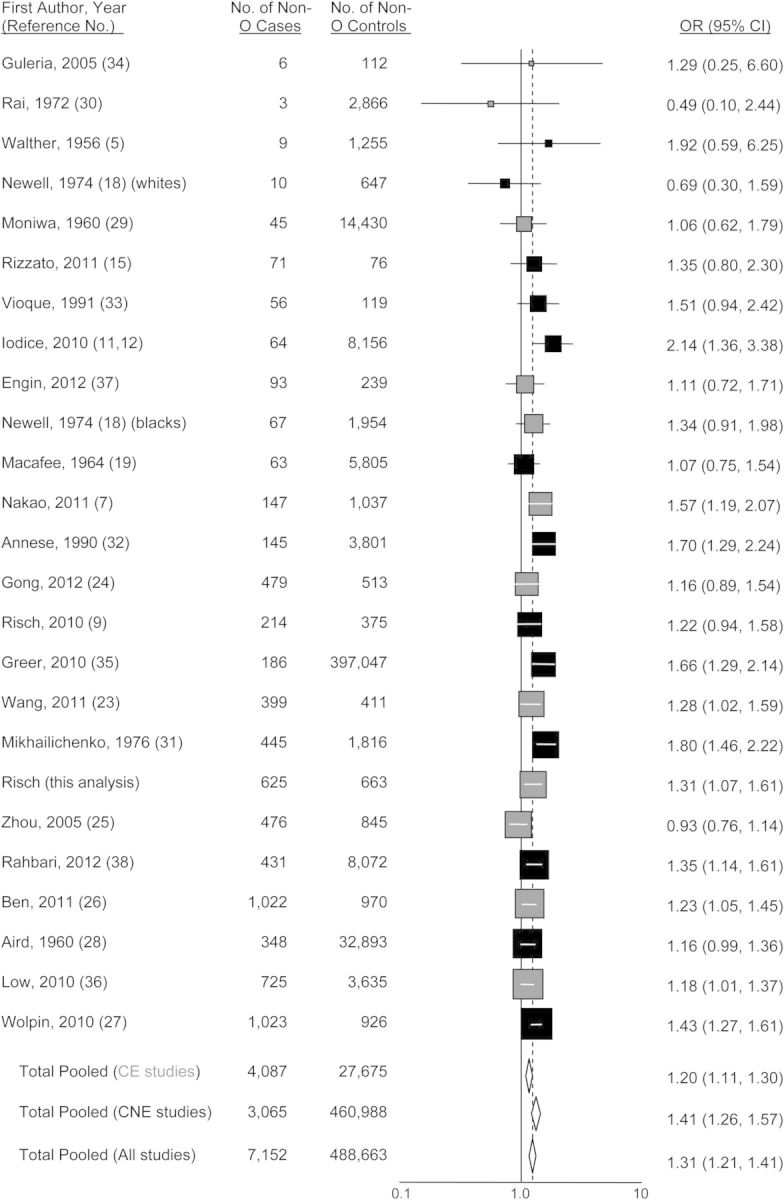
Random-effects meta-analysis forest plot of the odds ratio of pancreatic cancer according to non-O ABO blood groups taken as a whole, with respect to group O. The studies are arranged in descending order of their variances, as a funnel plot. The solid squares are centered on the odds ratio (OR) point estimate from each study, and the horizontal line through each square indicates the 95% confidence interval (CI) for the study estimate. The area of each square represents the relative weight of the study in the meta-analysis. The center of each diamond indicates the inverse variance-weighted summary estimate of the magnitude of association, and the horizontal tips of the diamond represent the 95% CI. Summary odds ratios are shown for all studies combined and separately for studies of CagA-positive Helicobacter pylori–endemic populations (“CE,” shown in gray) and CagA-nonendemic populations (“CNE,” shown in black).