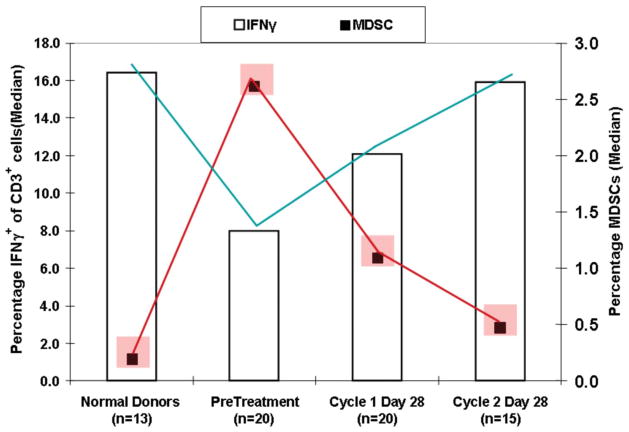
Figure 5.
RCC patients developed much reduced peripheral blood MDSCs and normalized T cell responses during 2 months of sunitinib treatment. Red blocks display average % frequency of MDSCs in peripheral blood of Normal Donors vs RCC patients before and during sunitinib treatment. Vertical bars display % of CD3+ T cells producing IFN-γ which normalized during sunitinib treatment.

