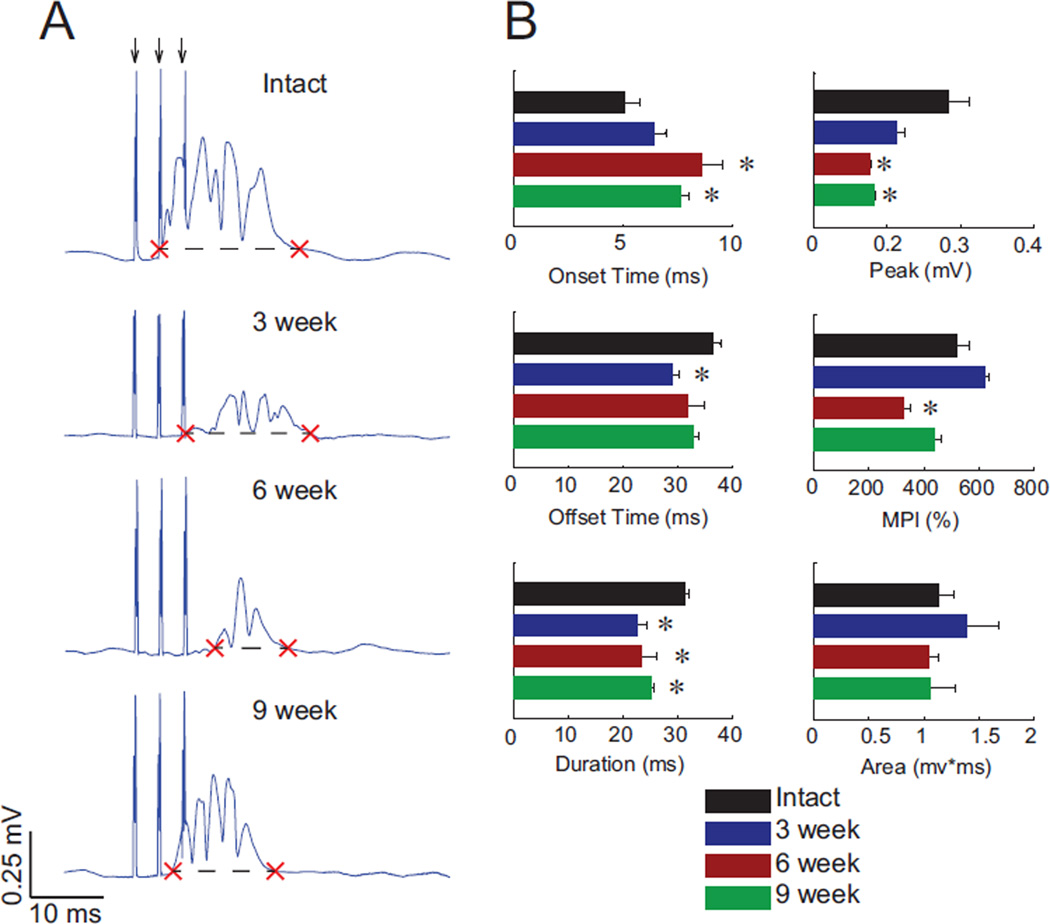
Figure 6.
Stimulus-triggered averages (StTA) of ISMS-induced muscle activity reveal progressive changes after spinal cord injury. A: Example StTAs from each experimental group: uninjured, and three, six, and nine weeks post-injury. Timing of the three stimulus pulses are shown by the arrows at top, and stimulus artifacts corresponding to each pulse are visible unless partly obscured by the evoked activity. Red X marks indicate onset and offset of response, and the dashed line denotes two standard deviations above baseline. B: Evoked EMG parameters from each experimental group for all muscles activated by ISMS (Mean ± SEM; * denotes p < 0.05 compared to spinally-intact animals).

