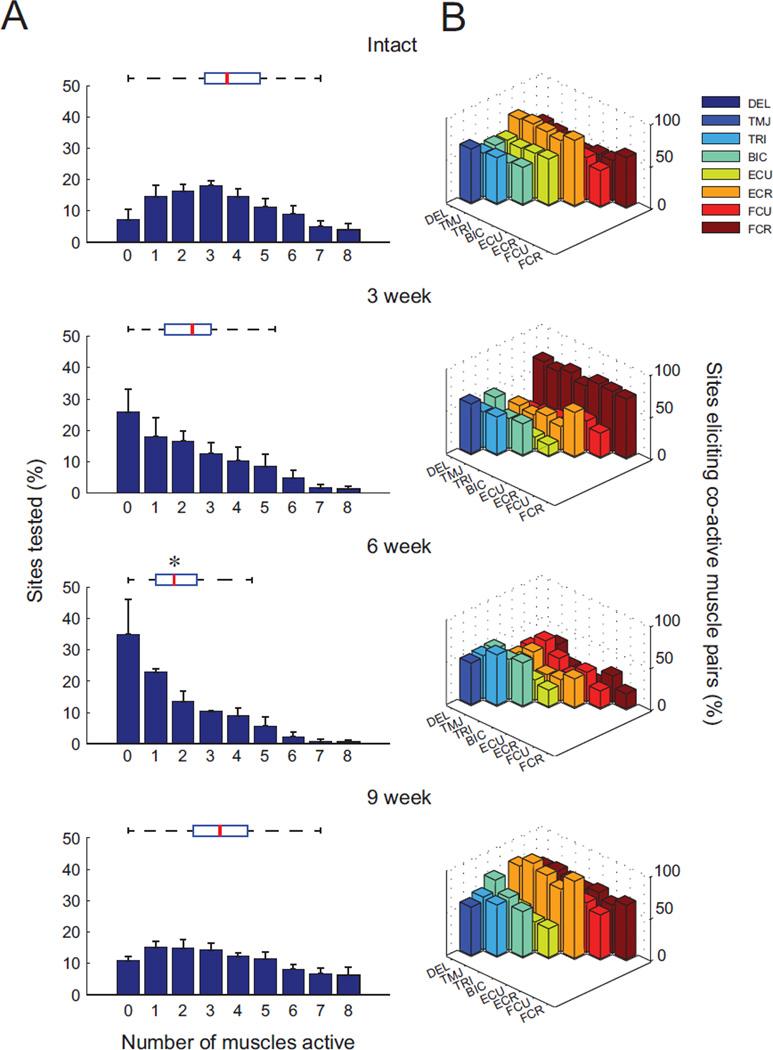
Figure 7.
Multiple muscles simultaneously activated by cervical ISMS. A: Histograms illustrating the percentage of sites where a given number of muscles were coactivated by ISMS. Box & whisker plots above each histogram show the median (red lines), upper and lower quartiles (box), and distribution (dashed lines) for each group of animals. Note that the distributions are similar for the spinally-intact and nine week injured animals despite a transient shift toward fewer coactive muscles at three and six weeks after injury (* denotes p < 0.05 compared to intact animals). B: Specific patterns of stimulus-evoked muscle coactivity, showing the percentage of times where a second muscle (indicated by a colored bar) was active normalized to the number of times the first muscle (indicated by axis label) was active. Extensor carpi radialis (ECR), shown in orange, was the most coactive muscle in both the spinally-intact animals and in animals 9 weeks after injury. For both panels, N = 5 spinally-intact animals, N = 3 animals per group at each post-injury time point.

