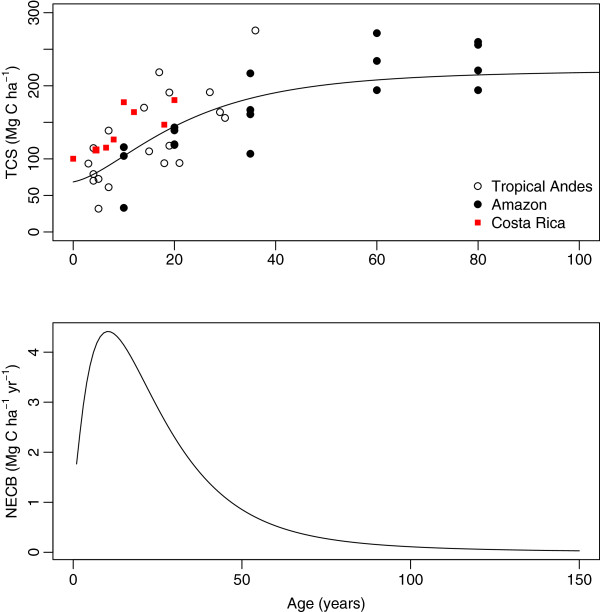
Figure 3.
Total carbon stocks (TCS, top) and net ecosystem carbon balance (NECB, bottom) with successional age. Open circles in top panel represent measurements obtained in this study, filled circles represent independent data reported by [21] for an Amazon tropical forest, and squares independent data from a lowland forest in Costa Rica [22]. Lines represent predictions by the fitted model (equation 1).

