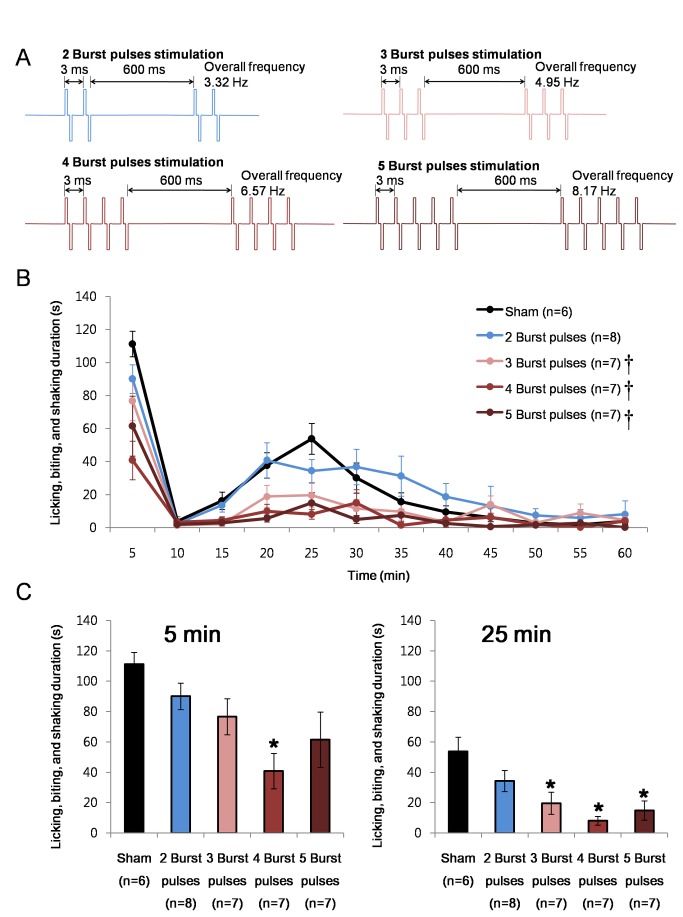
Figure 3. Number of burst pulses within a burst and anti-nociception.
(A) Schematic drawing of electrical stimulation protocols. (B) Comparison of the effect of VB stimulation with different burst pulse number per burst on formalin induced nociceptive responses. Repeated measures ANOVA was used for statistical analysis over time followed by Games-Howell post hoc. †P<0.05 (C) Bar graph of the time segments representing the peak of the 1st (0-5 min; F=4.56, P<0.05) and 2nd (20-25 min; F=6.74, P<0.05) phase nociceptive responses for better comparisons between different stimulation conditions. All data points are mean±SEM. One-way ANOVA followed by Games-Howell post hoc was used to compare each data point with the sham control, *P<0.05.

