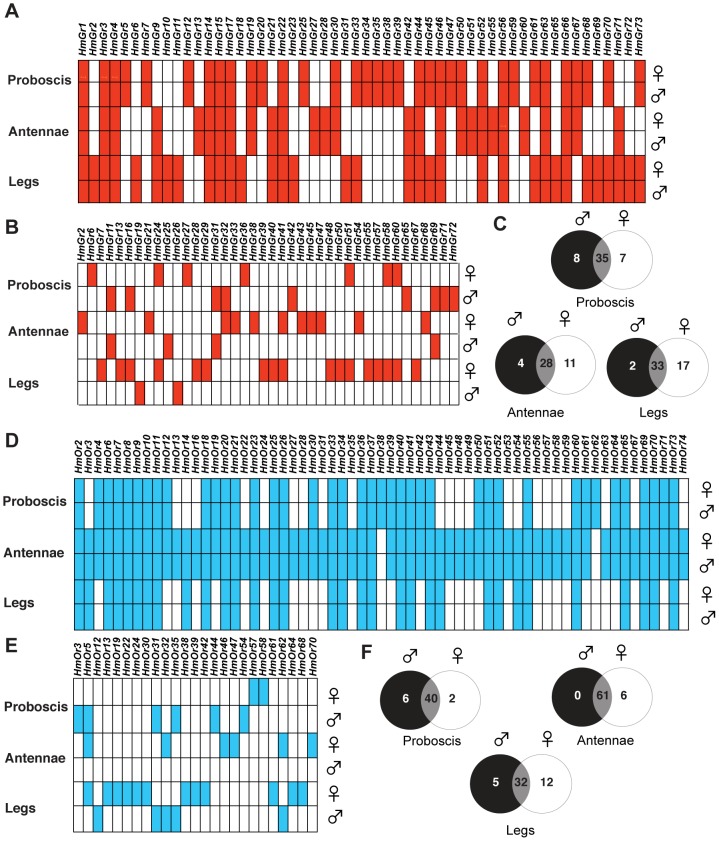
Figure 9. Comparison of Gr and Or expression in male and female adult H. melpomene chemosensory tissues.
(A) The common set of Grs expressed in each tissue in both males and females. Red box indicates the presence of reads uniquely mapping to the coding region of each Gr gene model. To facilitate the visualization of tissue-specific expression found in both males and females, only Grs where both sexes show expression are indicated. Where only one sex or neither sex shows expression, the box is empty. (B) Grs showing sex-specific expression. To facilitate the visualization of sex-specific Grs, only Grs where one sex shows expression are indicated by a filled box. Grs which are expressed in both sexes or no sex are indicated by an empty box. (C) Venn diagram showing the number of uniquely expressed gustatory receptors in each transcriptome. (D) The common set of Ors expressed in each tissue in both males and females. Blue box indicates the presence of reads uniquely mapping to the coding region of each Or gene model. As above, only Ors where both sexes show expression are indicated. Where only one sex or neither sex show expression, the box is empty. (E) Ors showing sex-specific expression are indicated by a filled box. Ors which are expressed in both sexes or no sex are indicated by an empty box. (F) Venn diagram showing the number of uniquely expressed gustatory receptors in each transcriptome. The proboscis libraries also included both labial palps, the antennal libraries included both antennae, and the leg libraries included all six legs.

