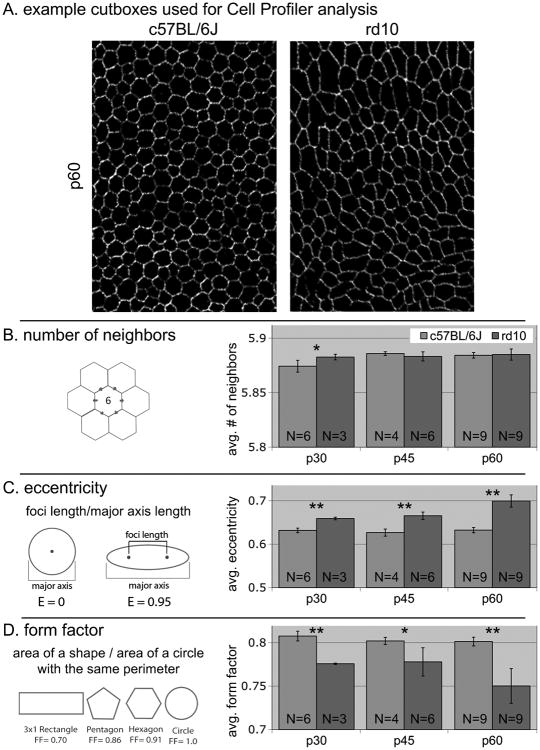
Fig.XX.2.
Averaged RPE cell morphometrics. A – examples of cutboxes used for analysis, these were taken from all areas of the flatmount where there were no dissection artifacts. B – number of neighbors is consistent suggesting that there is no cell death at these time points. C and D – measures of cell shape to used to determine if we can detect RPE cell differences early in this degeneration. * P<0.05, ** P<0.01

