
Figure 1. The evolution of spatiotemporal patterns in the network is plotted under spatial forcing current.
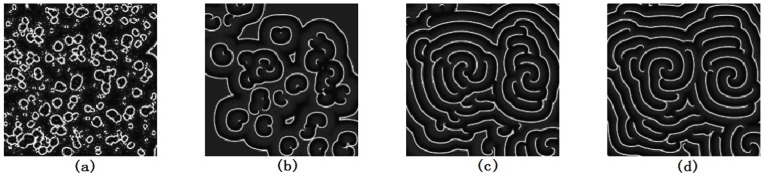
The spatial forcing currents are selected as 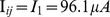 at
at  ;
; 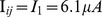 at
at  , and are imposed on
  nodes with stochastic distribution in the network, for t = 50 ms(a), t = 100 ms(b), t = 300 ms(c), t = 500 ms(d). The snapshots illustrate the distribution for membrane potentials of neurons in gray scale, the coupling intensity
  , parameter ration
  at
at  ;
;  at
at  , the forcing currents on the rest nodes are
 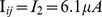 .
.