
Figure 2. The diagrammatic sketch (a) for spatial forcing currents on the network.
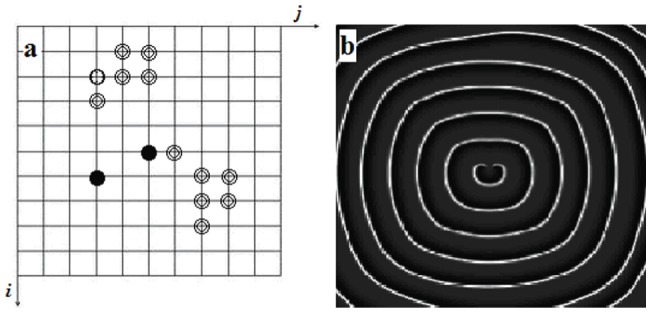
Spatial forcing currents 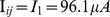 are imposed on the nodes(two solid black spots and one of the circles) in the network, the developed pattern for t = 200 ms. The snapshot(b) illustrates the distribution for membrane potentials of neurons in gray scale, the coupling intensity
  , the forcing currents on the rest nodes are
 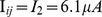 .
.