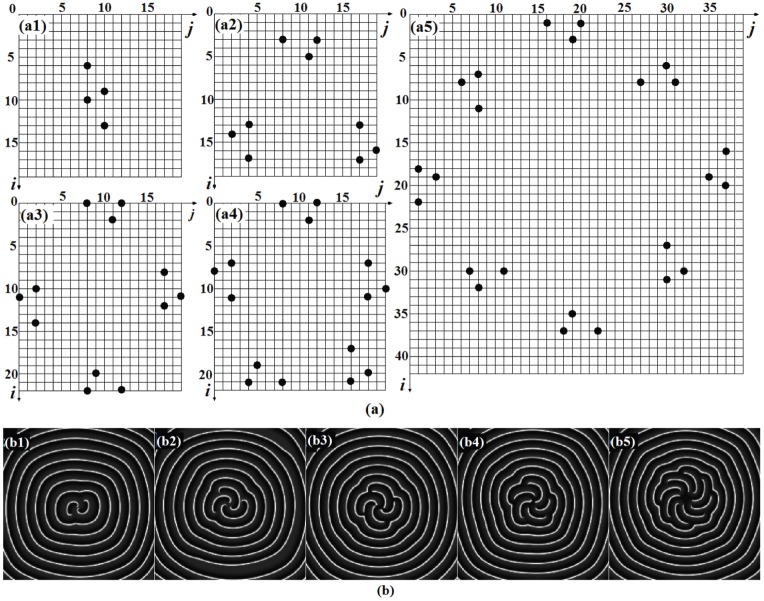
Figure 3. The diagrammatic sketch (a) for spatial forcing currents on controlled nodes in the network.
Spatial forcing current  at
at  (and
(and  at
at  ) are imposed on the nodes(solid black spots) in the network. (a1) for 2-arm spiral wave, (a2) for 3-arm spiral wave, (a4) for 4-arm spiral wave, (a5) for 8-arm spiral wave. The developed pattern for t = 200 ms(b)(enhanced online). The snapshots(two-arm, three arm, four-arm, five-arm, eight-arm spiral waves) illustrate the distribution for membrane potentials of neurons in gray scale, the coupling intensity
  , the forcing currents on the rest nodes are
  .
.

