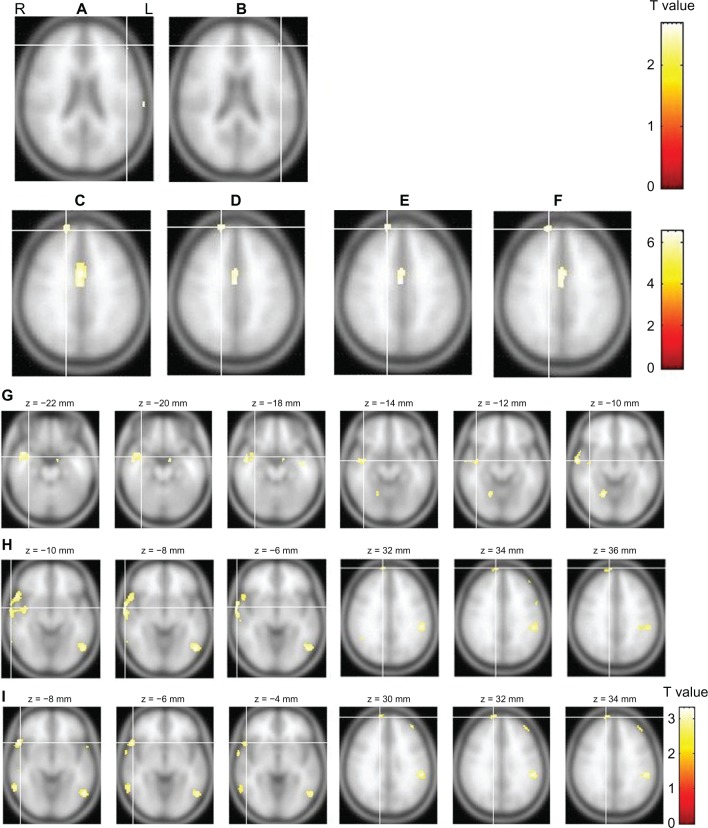
Figure 3.
The results of the fMRI analyses.
Notes: The slice views (A–F) showing fMRI activation in the frontal regions correspond to analyses 1–6, respectively, in Table 1, while (G–I) correspond to the last analyses 7–9, respectively, in Table 1 and reveal activation in the temporal and/or frontal regions. The results of analyses 3–6 are presented with a threshold at T = 4.73 (P < 0.05 [FWE corrected]), while the results of analyses 1,2 and 7–9 are presented with a threshold at T = 2.34 (P < 0.01 [unc]).
Abbreviations: FWE, family-wise multiple comparisons; L, left; R, right; unc, uncorrected for multiple comparisons; fMRI, functional magnetic resonance imaging.

