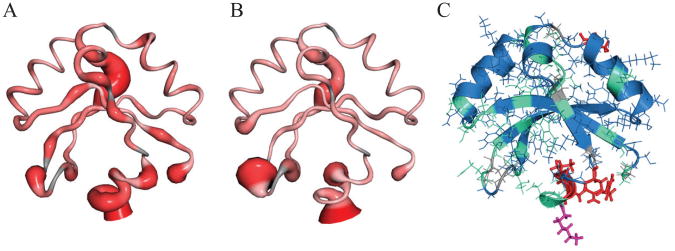
Figure 3.
NMR relaxation dynamics of the DamX SPOR domain. (A,B) Sausage figures depicting 15N-{1H} NOE and S2 values, respectively. Increasing flexibility (smaller values) is indicated by both increasing width and deeper red. (C) Structure colored according to motional models as determined by the program ModelFree 4.2. Blue = model 1 (S2; global tumbling only), green = model 2 (S2 + fast internal motions), red = model 4 (S2 + fast internal motion + Rex/chemical exchange), and magenta = model 5 (S2 + both fast and slow internal motions). No residues are best described by model 3.

