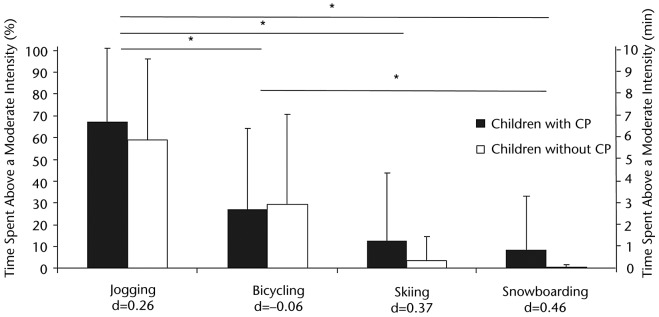
Figure.

Comparison of the relative time (%) (left axis) and actual time (minutes) (right axis) spent at an intensity greater than 40% of heart rate reserve for groups and games. Effect sizes (d) are shown for each game. CP=cerebral palsy. Asterisk indicates P<.05.
