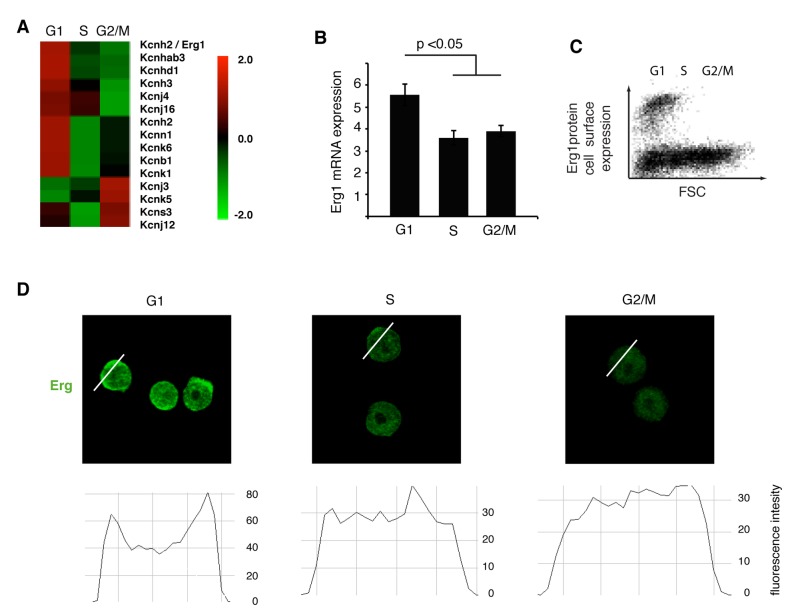
Figure 1. Cell cycle dependent Erg1 channel expression.
(A) Heat-map displaying mRNA differential expression of selected K+ channels in different cell cycle phases (ANOVA-test p<0.005). (B) Erg1 mRNA expression level evaluated using real-time PCR in cell cycle sorted mESCs (ANOVA-test). (C) Flow cytometry plot of live mESCs stained for an extracellular epitope of Erg1 channel. (D) Confocal images of mESCs sorted in different cell cycle stages and immunostained for Erg1 protein with cross section histograms (note that measurements across nucleoli were avoided) showing Erg1 immunostaining intensity with increased plasma membrane localization in G1.

