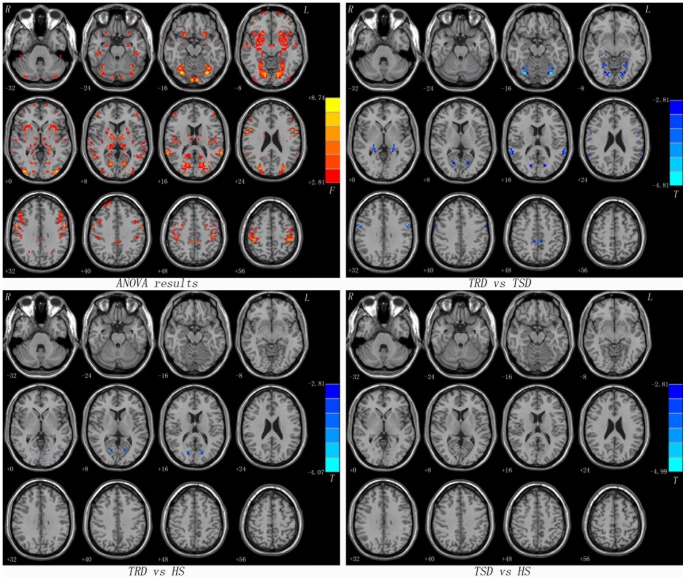
Figure 1. Statistical maps showing VMHC differences in different brain regions between studied groups.
Red denotes VMHC differences in the ANOVA analyses and the yellow/red color bar indicates the F value from the ANOVA analyses. Blue denotes lower VMHC and the green/blue color bars indicate the T value from post hoc analysis between compared groups. Of note, the two-sample t-test results within a mask showed significant group differences in the ANOVA analysis. VMHC = voxel-mirrored homotopic connectivity, TRD = treatment-resistant depression, TSD = treatment-sensitive depression, HS = healthy subjects.

