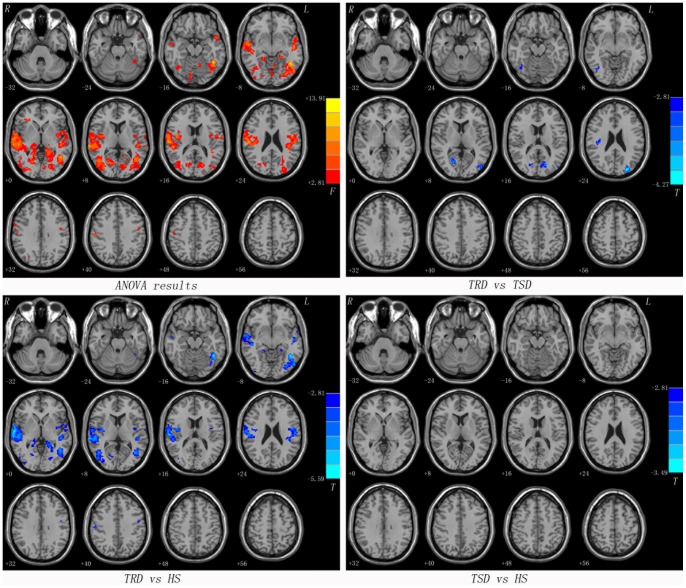
Figure 2. Statistical maps showing seed-based FC differences between subject groups (seed: the left calcarine cortex).
Red denotes FC differences in the ANOVA analyses and the color bar indicate the F value from the ANOVA analyses. Blue denotes lower FC and the color bars indicate the T value from post hoc analysis between each pair of groups. Of note, the two-sample t-test results within a mask showed significant group differences in the ANOVA analysis. FC = functional connectivity, TRD = treatment-resistant depression, TSD = treatment-sensitive depression, HS = healthy subjects.

