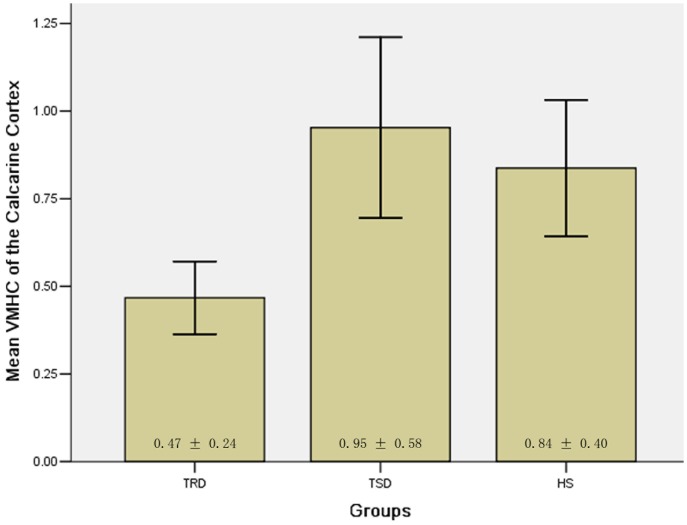
Figure 4. Bar plots representing the mean (and standard error) VMHC value of the calcarine cortex.
Significant differences found between the TRD group and the TSD group or the HS group (TRD vs TSD: p<0.001; TRD vs HS: p<0.01). VMHC = voxel-mirrored homotopic connectivity, TRD = treatment-resistant depression, TSD = treatment-sensitive depression, HS = healthy subjects.

