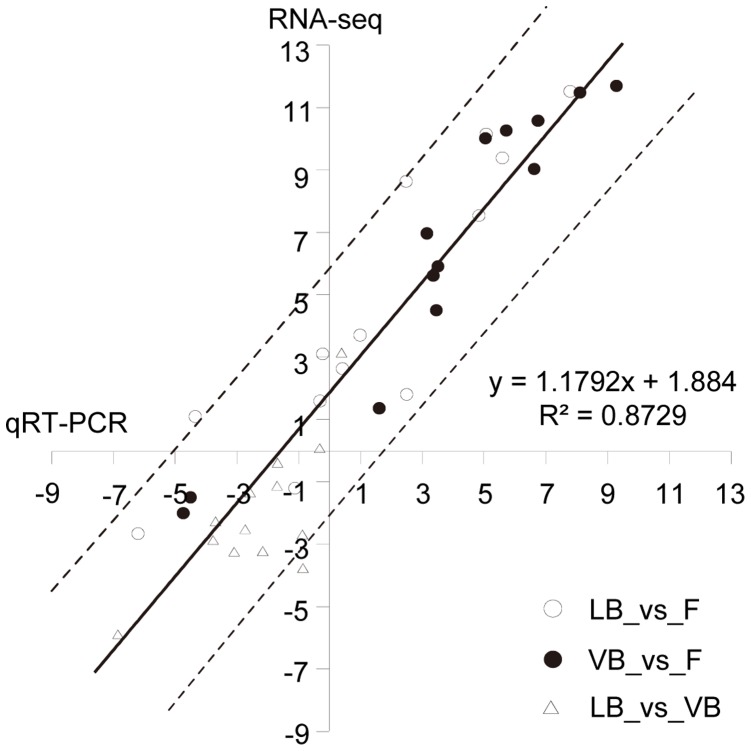
Figure 3. Validation of RNA-seq results by quantitative reverse transcription-polymerase chain reaction (qRT-PCR).
Expression of 13 genes was determined using qRT-PCR for the free-living Sinorhizobium sp. NGR234, L. leucocephala and V. unguiculata bacteroids. The expression ratios were calculated for L. leucocephala bacteroids vs. free-living (LB_vs_F), V. unguiculata bacteroids vs. free-living (VB_vs_F), and L. leucocephala bacteroids vs. V. unguiculata bacteroids (LB_vs_VB). The log2-transformed expression ratios from RNA-seq (vertical axis) and qRT-PCR (horizontal axis) are shown. The solid and dashed line(s) depicted the linear curve and the individual confidence intervals (95%). The linear equation and R square values are shown.

