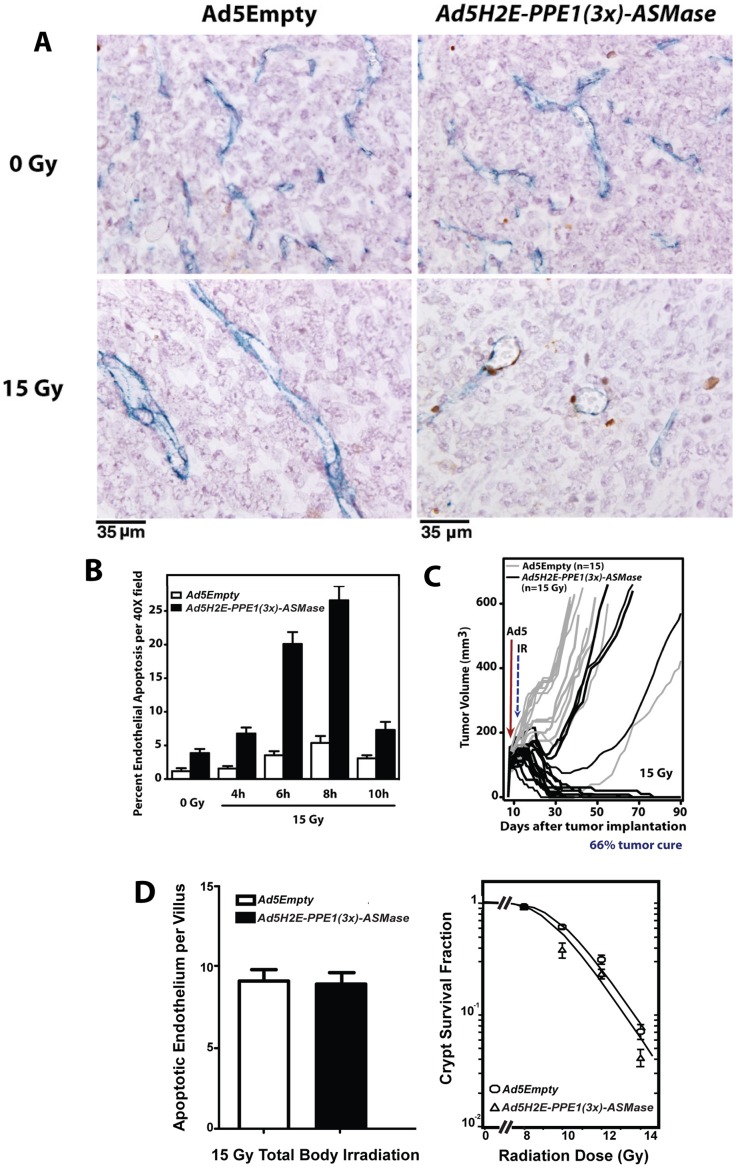
Figure 5. Expression of ASMase in endothelium of MCA/129 fibrosarcomas implanted in asmase−/− mice restores radiation-induced endothelial apoptosis and tumor cure.
MCA/129 fibrosarcoma cells (106, resuspended in PBS) were injected intra-dermally into the right hind limb of asmase−/− mice (A, B, C) and tumor volume (based on caliper measurements) was calculated daily according to the formula by Kim et al. [54]. At 90–130 mm3, 1×10¹⁰ PFU of Ad5Empty or Ad5H2E-PPE1(3x)-ASMase was administered intravenously. 5 days post viral administration tumors were locally irradiated with 15 Gy or left untreated. (A) Representative cross sections of MCA/129 fibrosarcoma excised from unirradiated animals (upper panel) and at 6 hours post 15 Gy (lower panel), and co-stained for an endothelial-specific marker (Meca-32, blue) and apoptosis (TUNEL; brown). (B) Quantitation of the effect of Ad5H2E-PPE1(3x)-ASMase treatment on radiation-induced endothelial cell apoptosis. Data (mean ± SEM) represent TUNEL-positive endothelial cells quantified from 20 fields/tumor (400× magnification) and 2 tumors per group. (C) Impact of treatment with Ad5Empty (gray lines) or Ad5H2E-PPE1(3x)-ASMase (black lines) followed by 15 Gy on MCA/129 fibrosarcoma response. N equals number of animals per group. Tumors were measured daily up to 40 days and twice weekly thereafter. (D) Lack of impact of Ad5H2E-PPE1(3x)-ASMase on small intestinal radiation sensitivity. Mice, pre-treated for 5 days with Ad5Empty or Ad5H2E-PPE1(3x)-ASMase, were subjected to 15 Gy (left) or 8–14 Gy (right) total body irradiation known to cause GI damage. Mice were sacrificed at 4 h (left) for endothelial apoptosis measurement or after 3.5 days (right) for Crypt Microcolony Assay as standardized in [18], [27]. Endothelial apoptosis was identified by microscopic co-detection of TUNEL (brown) and MECA-32 (blue) staining. Data (mean ± SEM) were compiled from 2 mice each, analyzing apoptotic cells in the lamina propria of 20 intact crypt-villus units per mouse. Crypt survival curves were calculated using 2 mice per dose analyzing 5–10 crypt-villus units per mouse by least square regression analysis, with a modification of the FIT software program [55]. The program fits curves by iteratively weighted least squares to each set of dose–survival data, estimates covariates of survival curve parameters and corresponding confidence regions, and plots the survival curve.

