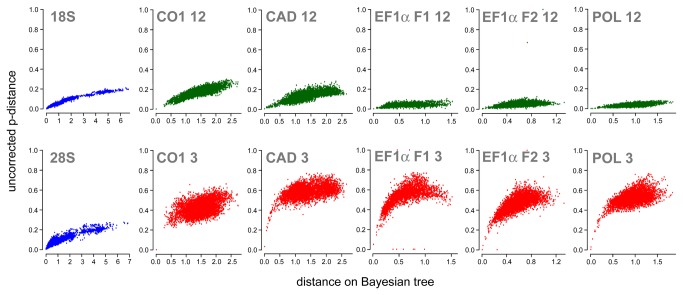
Figure 1. Saturation plots of the different genes and codon positions.
Uncorrected p-distances are shown on the y-axis, while the x-axis represents the pairwise distances as inferred on the tree recovered from the single-gene analyses. “CO1 12” indicates the combined first and second codon position of the CO1 gene, and so forth.

