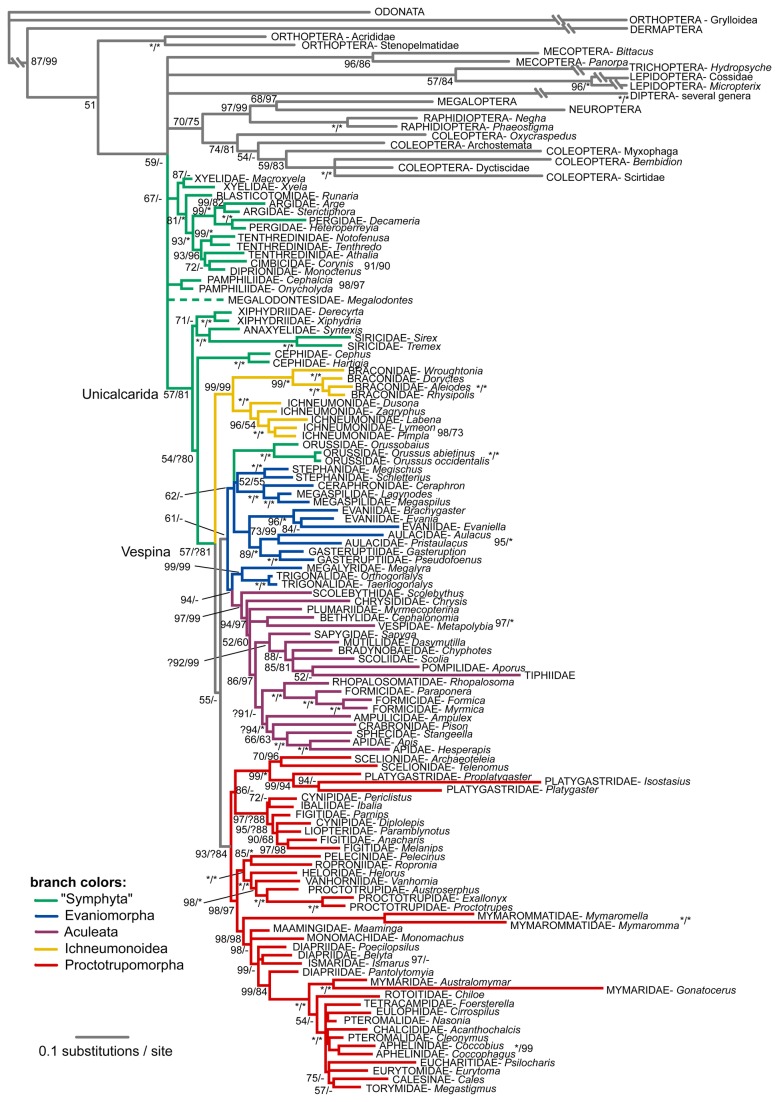
Figure 2. Bayesian tree recovered from the analysis of the two ribosomal genes under the MAFFT alignment.
Support values next to the nodes are Bayesian posterior probabilities obtained from the MAFFT and the BAli-Phy alignments, respectively. Asterisks stand for maximal support. Taxa identified as rogues are shown on dashed branches. Very long branches leading to some of the outgroup taxa were compressed in this figure.

