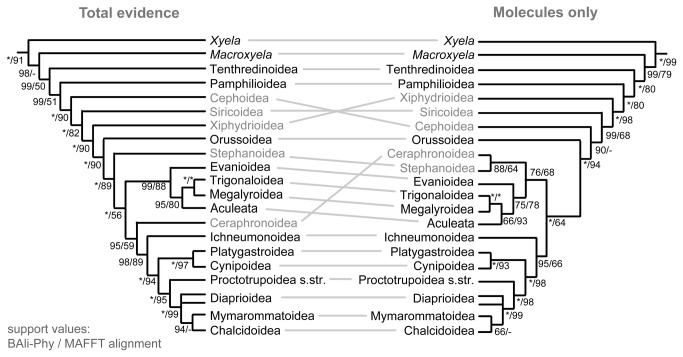
Figure 6. Simplified total-evidence tree based on the combined molecular and morphological data contrasted with the tree obtained from the molecular data alone.
Support values are in both cases given for both the BAli-Phy-based and the MAFFT alignment of the rRNA genes, with asterisks representing maximal support. Taxa which assume conflicting positions are shown in grey.

