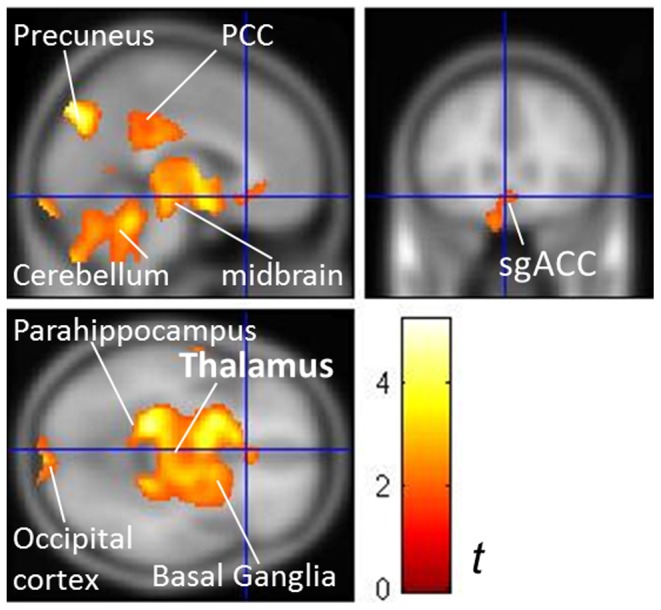
Figure 4. rTMS-related metabolic change in responders (3-month vs. baseline).

Responders demonstrated significantly decreased metabolism in the thalamus, midbrain, cerebellum, posterior cingulate cortex (PCC), basal ganglia, occipital cortex, parahippocampus and subgenual anterior cingulate cortex (sgACC). Contrast bar denotes t values. The significance was set at a cluster-level corrected P<0.001 by paired-t tests.
