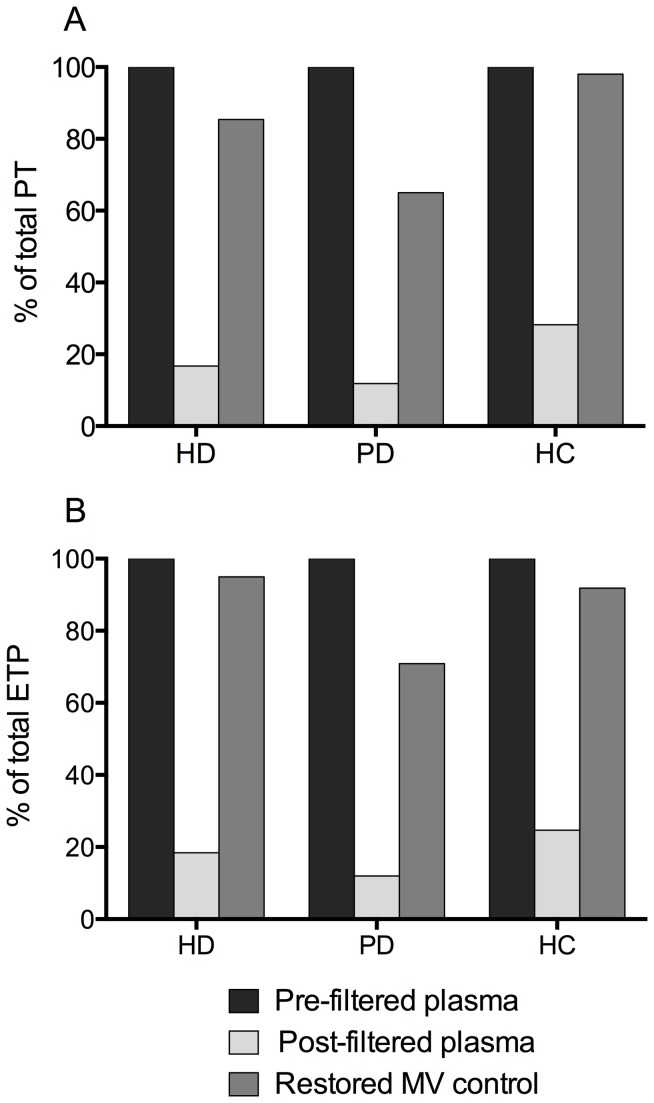
Figure 6. Measurement of thrombin generation in restored microvesicle controls.
Peak thrombin (A) and endogenous thrombin potential (B) were measured post-filtration (light grey bars) and in restored MV controls (dark grey bars), and are expressed as a percentage of pre-filtered levels (black bars). HD, haemodialysis; PD, peritoneal dialysis; HC, healthy control.

