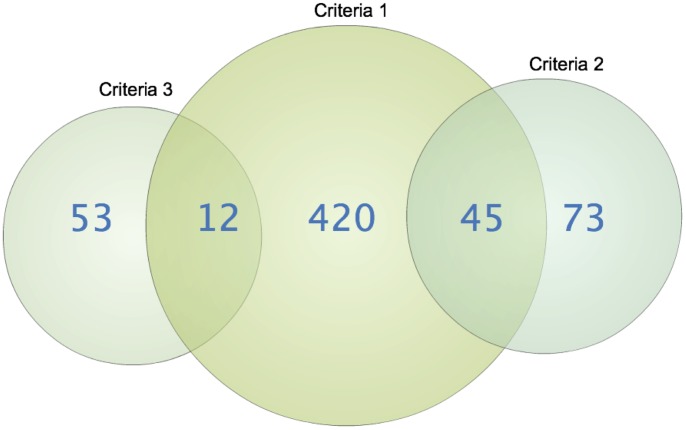
Figure 2. Illustration of the three inclusion criteria used for pathway and interaction analyses.
The first criteria of p-values less than 3.0×10⁻⁴ in the linkage TDT analysis resulted in a total of 477 markers. The second criteria included a comparison of the results from this study with the results from the study by Dubois et al. [3]. We included 118 SNPs that had a simple score based on a combined p-value less than 5.0×10⁻⁵ and in the same allelic direction in both datasets. The third criteria involved selecting markers with a large effect size. We included 65 markers which had a ratio of transmitted versus not transmitted (T/NT) alleles of over 5 or below 0.2, combined with a p-value of less than 2.0×10⁻³.

