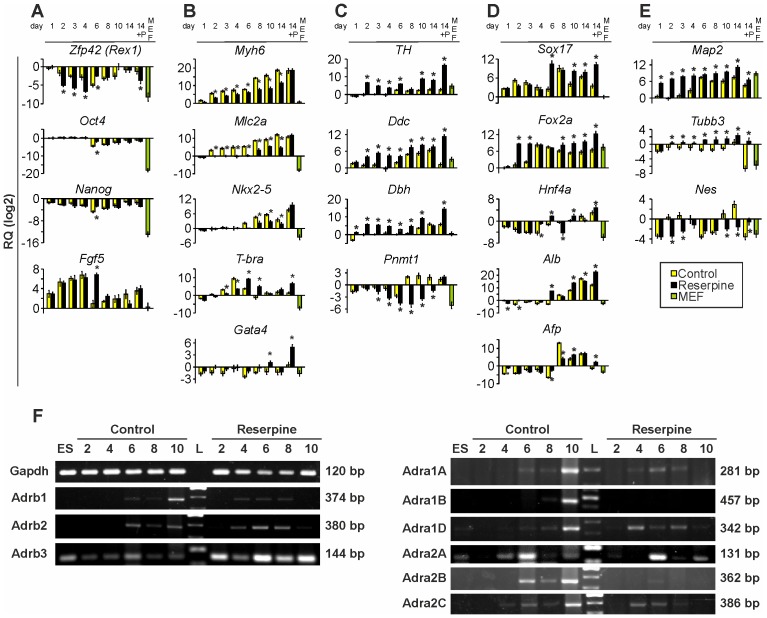
Figure 3. Quantitative real-time PCR analysis during ES cell differentiation.
Time course of relative expression of (A) pluripotency genes (Zfp42, Oct4, Nanog) and differentiation marker (Fgf5), (B) cardiac specific genes (Myh6, Mlc2a) and mesodermal markers (Nkx2-5, Gata4 and T-bra), (C) catecholamine synthesis genes (TH, Ddc, Dbh, Pnmt), (D), endodermal marker genes (Sox17, Fox2a, Hnf4a, Alb, Afp), (E) ectodermal and neuronal markers (Map2, Tubb3, Nes). 14+P: d14 puromycin purified clusters; MEF: mouse embryonic fibroblasts. Values represent relative quantities (RQ) plotted on a log2 scale. Primers are listed in Table 1. (F) Semiquantitative reverse-transcription PCRs from ES cells (ES), control and reserpine-treated EBs during differentiation from day 2 to day 10 representative of the gene expression of α- and β-AR subtypes (α1A, α1B, α1D, α2A, α2B, α2C, β1, β2, β3; Gapdh was used as house-keeping control). L: DNA Ladder. Amplified fragment sizes are stated on the right of each pane.

