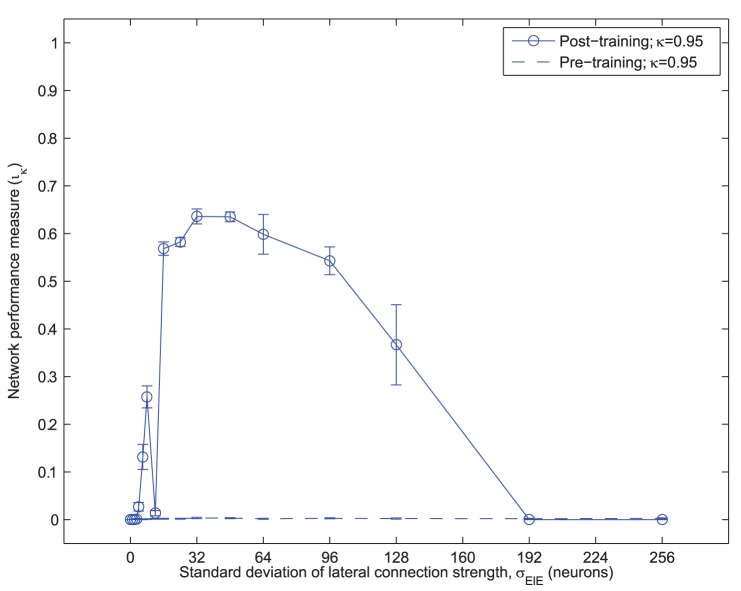
Figure 9. Network performance versus lateral connection spread.
The mean network performance measure ( ) is plotted against the standard deviation of the lateral excitatory connection strength (
 ) for ten random seeds, with the standard error of the mean indicated by the whiskers. It can be seen that network performance is robust to approximately a four-fold increase in
  .
.

