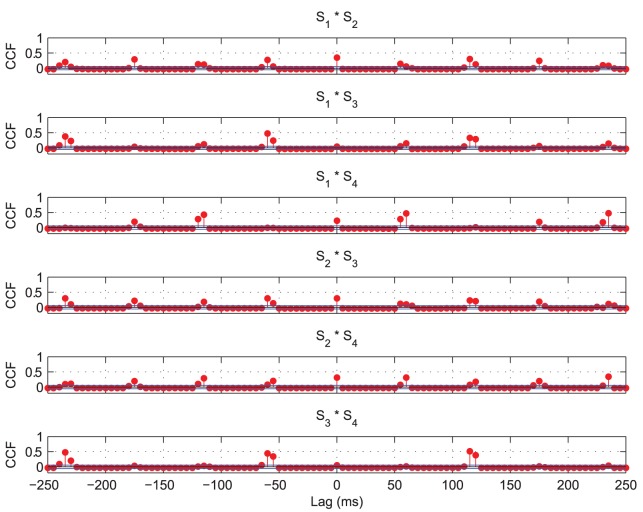
Figure 15. Input layer cross-correlation functions with four stimuli.
Significant cross-correlations can be seen at multiples of approximately  , indicating that at least one stimulus is represented every
  . There are also significant cross-correlations at
  lag for some of the pairs of stimuli, showing that on this particular training epoch, the firing of those stimuli was still (at least partially) synchronised. However, inspecting the data from other training epochs confirmed that the synchronised pairs changed between presentations.

