
Figure 1.
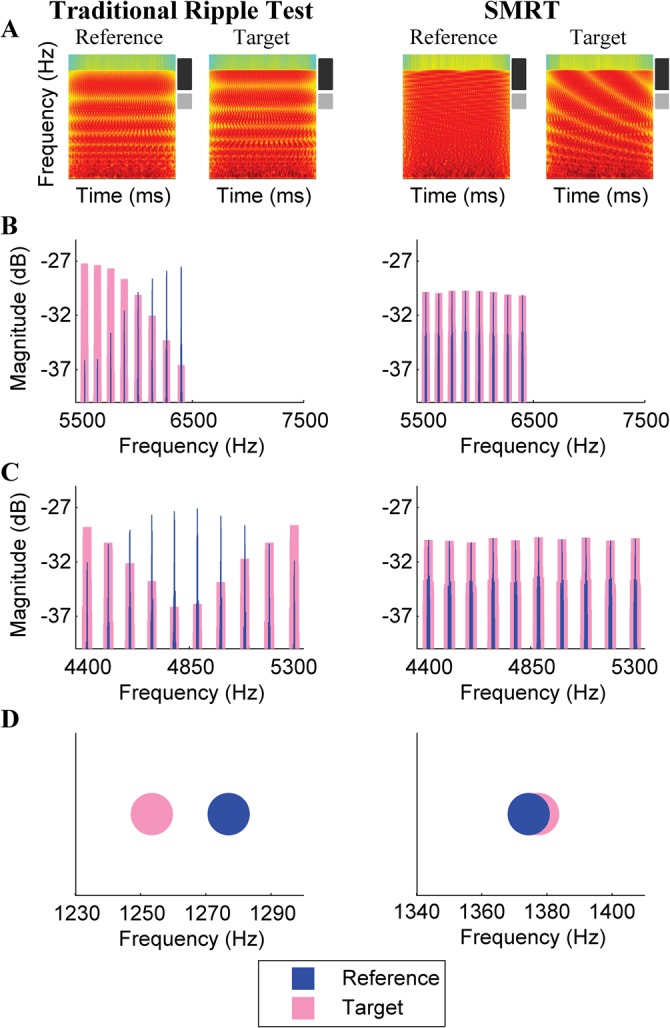
(Color online) Comparison of the traditional ripple stimuli and the stimuli for the SMRT. Both the traditional and SMRT stimuli were generated using Eq. 1. (A) Spectrograms of reference and target stimuli for the traditional ripple task and the SMRT. (B) Spectrums of the high frequency edge, indicated by the dark rectangles next to the spectrograms in (A), for the two tasks. These spectrums indicate that, unlike with the traditional ripple task, there is no shift in the high frequency edge between the reference and target stimuli for the SMRT. (C) Spectrum of a portion of the frequency region, indicated by the light rectangles next to the spectrograms in (A). These spectrums indicate that local loudness cues are present in the traditional ripple task but absent in the SMRT. (D) Spectral centroid for the reference and target stimuli. These plots illustrate how the centroids for the target and masker differ in the traditional ripple task versus in the SMRT.