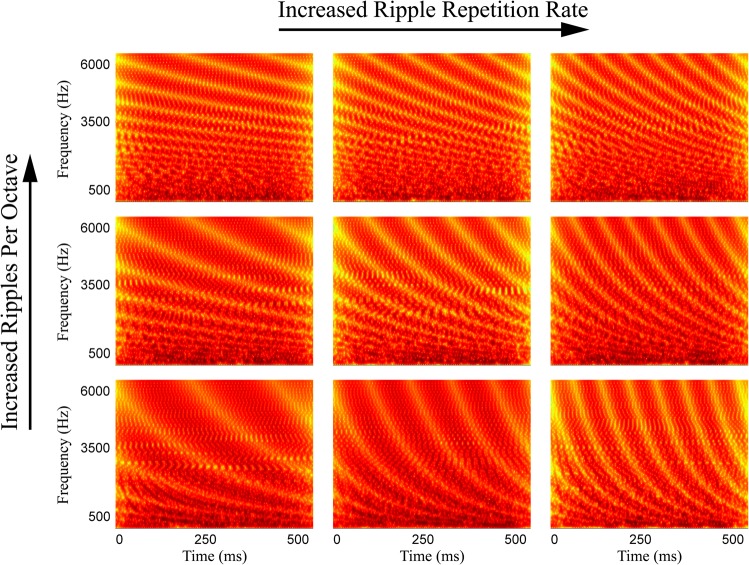
Figure 2.
(Color online) Spectrograms of stimuli generated using Eq. 1 showing the orthogonal effects of manipulating the ripple repetition rate and the number of ripples per octave. The first column represents the ripple repetition rate used for the SMRT.

