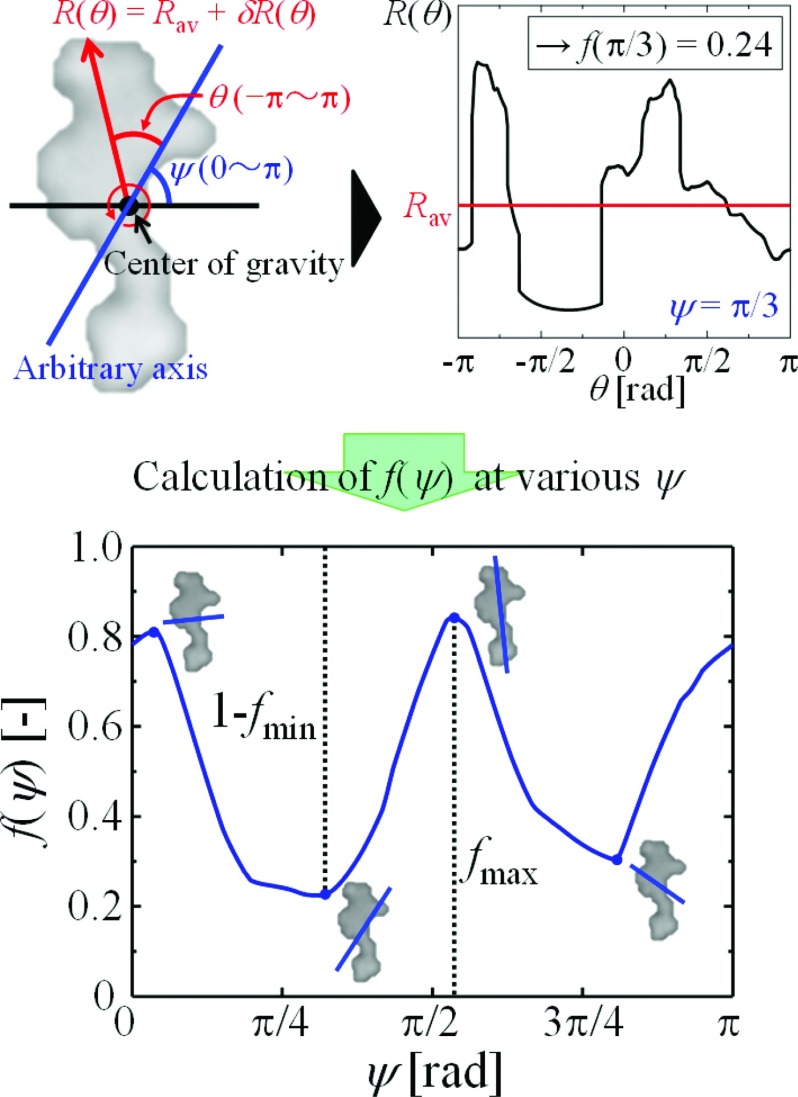
Figure 4.
Typical example of quantitative analysis of particle morphology [using the particle from Fig. 3a]. Top: (left) schematic representation of quantitative analysis of particle morphology and (right) profiles of R(θ) (−π ≤ θ ≤ π) from an axis tilted at angle ψ (ψ = π/3). Bottom: calculation result for f(ψ) of an arbitrary axis at various angles ψ (0 ≤ ψ ≤ π).

