
Figure 11.
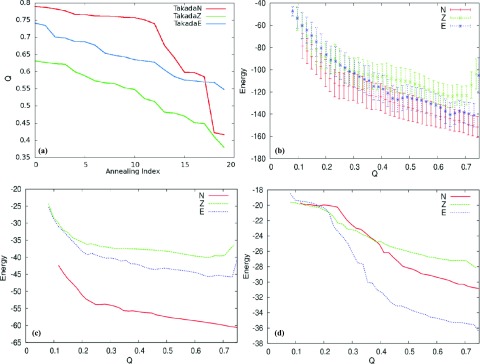
Plot of Q versus annealing index of the three Takada sequences (a). Plots of the expectation value of the total energy (b), the fragment memory energy (c), and the tertiary energy (d). TakadaN is shown in red, Takada Z is shown in green, and TakadaE is shown in blue.