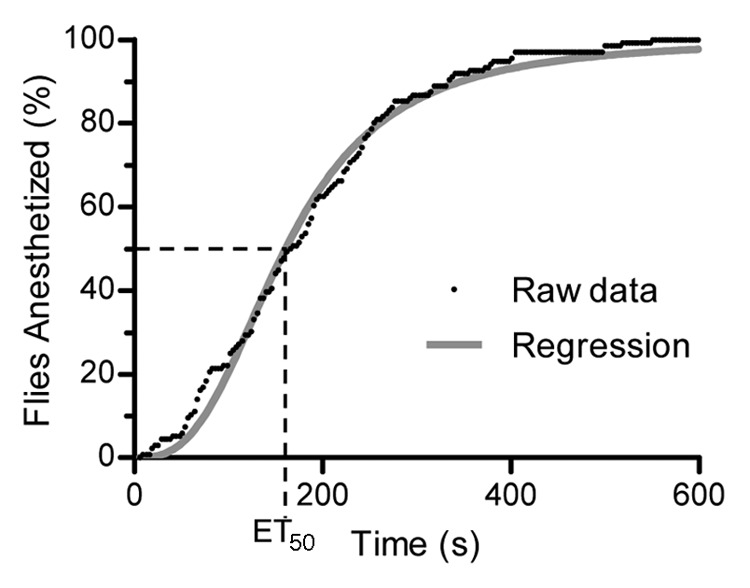
Figure 1. Observed inebriometer data and regression analysis. The raw data of flies falling out of the inebriometer, collected in 3-sec intervals, is plotted as the percent of the total number of flies anesthetized in 10 min. Regression analysis of this data are performed (as described in Materials and Methods) to allow for the calculation of the time it takes for half of the flies to be anesthetized (ET50). The data as presented here represent one run.
