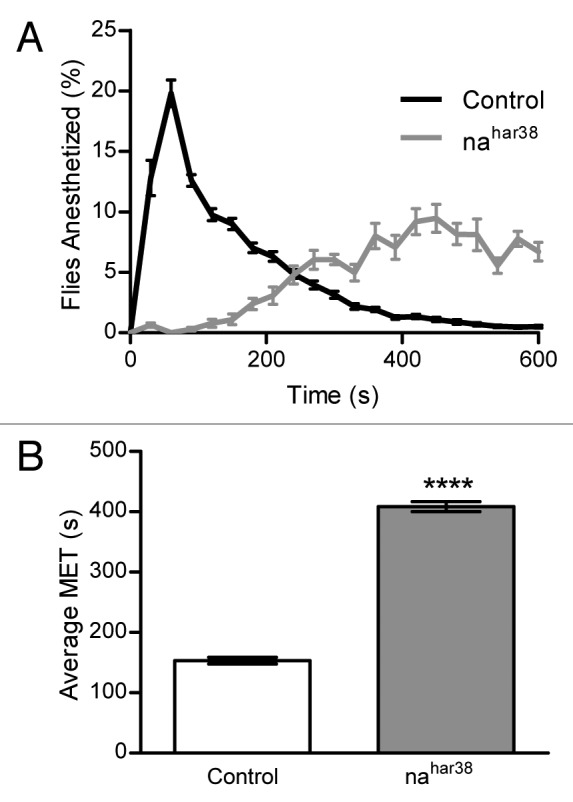
Figure 3. The inebriometer effectively quantifies differences in isoflurane responses between control and nahar38 flies. (A) Elution profiles of control (Oregon-R) and heterozygous female nahar38/FM6 (nahar38) flies in response to 1% isoflurane. Flies were counted in 30-sec intervals and divided by the total number of flies that fell in 10 min. The data points represent the mean ± SEM of the percentage of flies eluting at that time point from at least 12 runs. (B) The MET was calculated as described in Materials and Methods for the data shown in (A). The nahar38 MET is larger than that of the control flies (****p < 0.0001) as determined by a one-tailed, unpaired t-test, assuming equal variances.
