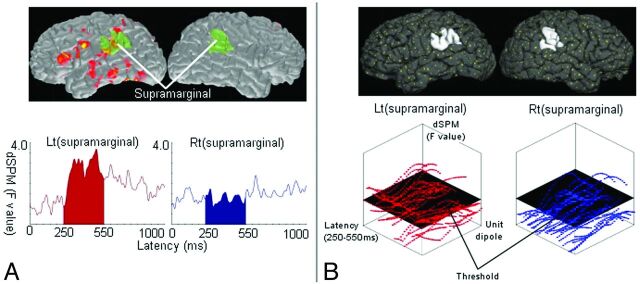
Fig. 2.
Schematic representation for calculating the LI. LI is calculated by the formula (L − R)/(L + R), where L and R represent parameters obtained from the source distribution within a time window of 250–550 ms in the left and right ROIs, respectively. A, dSPM-amplitude method. The source waveform averaged in each region of interest is extracted from dSPM. L and R are the sum of these waveforms in left and right ROIs. The figure shows an example of processing in a pair of ROIs (supramarginal gyri). The dSPM (top) provides source waveforms averaged within the left and right supramarginal gyrus (bottom). B, dSPM-counting method. In dSPM, each unit dipole (top; yellow dots) has a value of activation. Within each region of interest (eg, the left and right supramarginal gyrus; top), the values of numerous unit dipoles are obtained at each time point (bottom). The number of unit dipoles with a value over a threshold is counted. L and R are the total number of unit dipoles counted in left and right ROIs.

