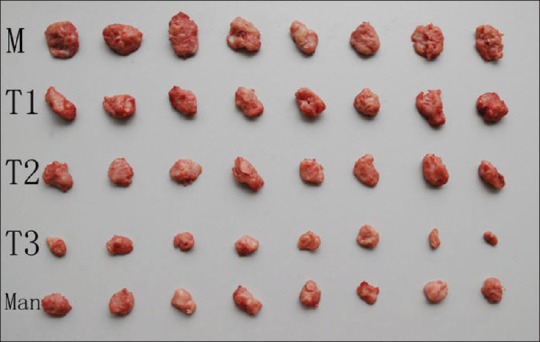
Figure 3.

Inhibition of the series of TMP-A on the growth of S180 tumor (mean ± SD, n = 8), N: negative control group; T1, T2, T3 indicating TMP-A groups of 20 mg/kg, 40 mg/kg, 80 mg/kg, respectively; Man: Positive control group of mannatide

Inhibition of the series of TMP-A on the growth of S180 tumor (mean ± SD, n = 8), N: negative control group; T1, T2, T3 indicating TMP-A groups of 20 mg/kg, 40 mg/kg, 80 mg/kg, respectively; Man: Positive control group of mannatide