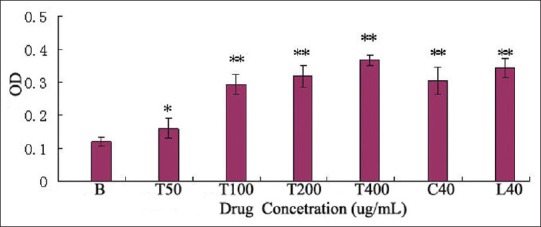
Figure 5.

Effect of TMP-A, ConA, and LPS on mouse macrophage cell, B: Blank control group; C: ConA group; L: LPS group; T: TMP-A group, Significant differences from negative control group and positive control group were evaluated using Student's t test: *P < 0.05, **P < 0.01
