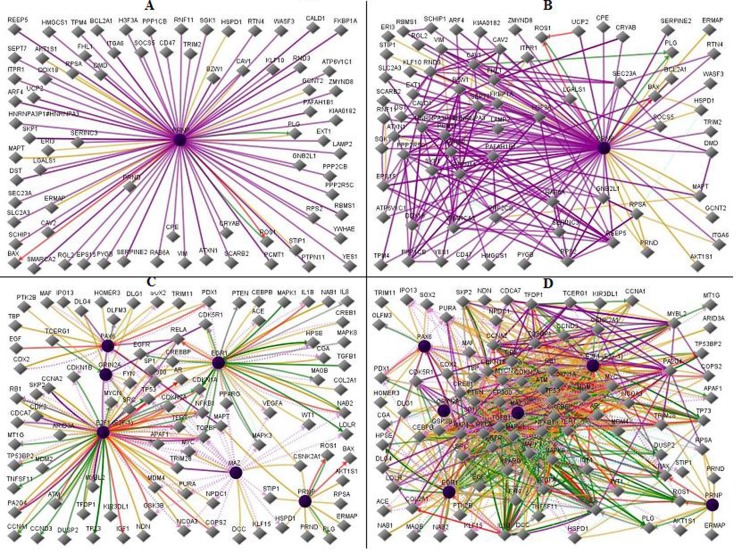
Figure 1.
A) Network of input prion - protein, PRNP with immediate input neighbors. In this figure, line-colors and various interactions with other genes are red Down-regulation, green Up-regulation, beige Regulation, purple Co-expression, brown Physical Interaction, turquoise dotted Predicted Protein Interaction, and mauve dotted Predicted TFactor Regulation [6]. The genes shown interacting with the PRNP gene are immediate interactions; B) Network of input prion - protein, PRNP with additional output neighbors. In this figure, line-colors and various interactions with other genes are red Down-regulation, green Upregulation, beige Regulation, purple Co-expression, brown Physical Interaction, turquoise dotted Predicted Protein Interaction, and mauve dotted Predicted TFactor Regulation [6]. This figure is a continuation of the genes shown in Figure 1A and shows additional levels of interactions among the genes; i.e. many of these are downstream from the first level shown in Figure 1A. C) Network of input proteins PRNP, E2F-1, MAZ, PAX6, EGR1, and GRIN2A with immediate input neighbors. In this figure, line-colors and various interactions with other genes are red Down-regulation, green Up-regulation, beige Regulation, purple Co-expression, brown Physical Interaction, turquoise dotted Predicted Protein Interaction, and mauve dotted Predicted TFactor Regulation. [6] The expression of the proteins illustrated PRNP, E2F-1, MAZ, PAX6, EGR1, and GRIN2A are perturbed in conjunction with miRNAs. The gene networks shown are immediate interactions. D) Network of input proteins PRNP, E2F-1, MAZ, PAX6, EGR1, GRIN2A and additional output neighbors. In this figure, line-colors and various interactions with other genes are red Downregulation, green Up-regulation, beige Regulation, purple Co-expression, brown Physical Interaction, turquoise dotted Predicted Protein Interaction, and mauve dotted Predicted TFactor Regulation [6]. This figure is a continuation of the genes shown in Figure 1C and shows additional levels of interactions among the genes; i.e. many of these are downstream from the first level shown in Figure 1C.

