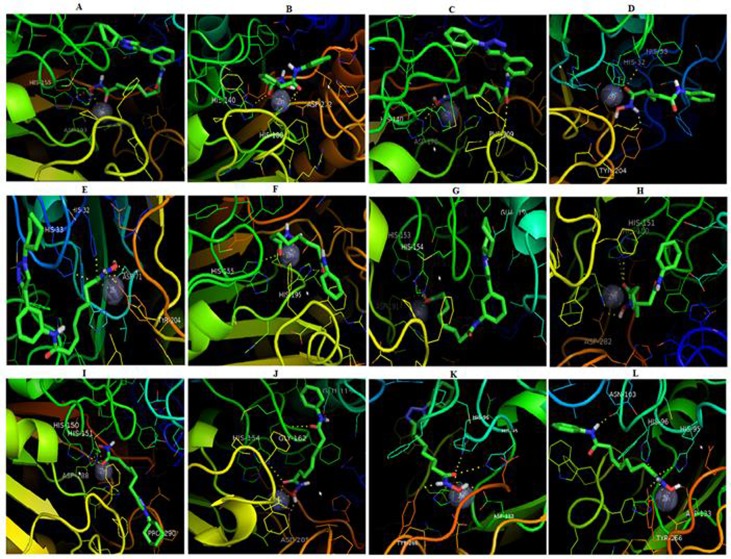
Figure 2.
3D interaction of docking simulation results between (A) ligand 2c (B) SAHA with HDAC 4. Between (C) ligand 2a (D) with SAHA HDAC 5. Between (E) ligand 2c (F) with SAHA HDAC 6. between (G) ligand 2c (H) with SAHA HDAC 7. Between (I) the ligand 1c (J) with SAHA HDAC 9. Between (K) ligand 1c (L) with SAHA HDAC 10.

